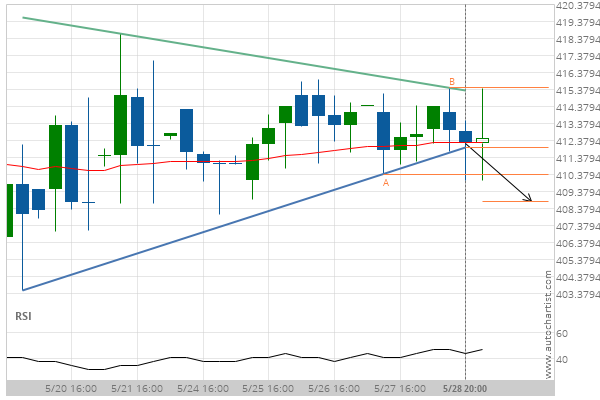
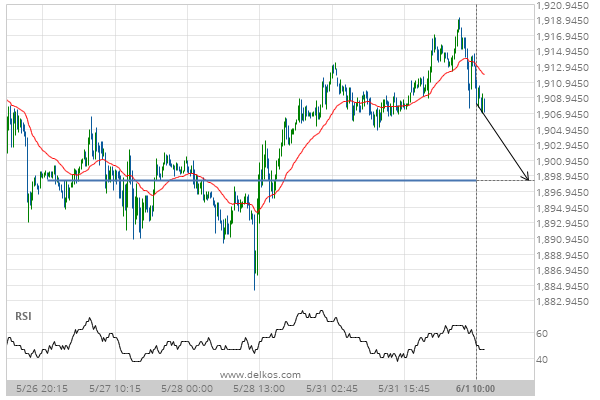
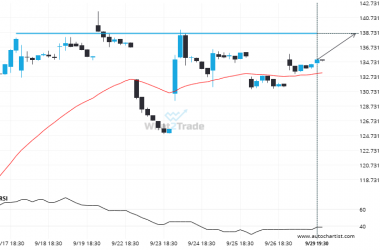
Unitedhealth Group Inc. has broken through the support line of a Triangle technical chart pattern. Because we have seen it retrace from this position in the past, one should wait for confirmation of the breakout before trading. It has touched this line twice in the last 10 days and suggests a target line to be around 408.78 within the next 2 days.
Related Posts
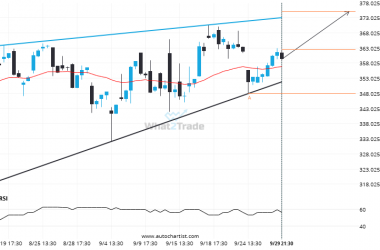
ADBE is approaching a resistance line of a Rising Wedge. It has touched this line numerous times in the last 49 days.
The movement of ADBE towards the resistance line of a Rising Wedge is yet another test of the…
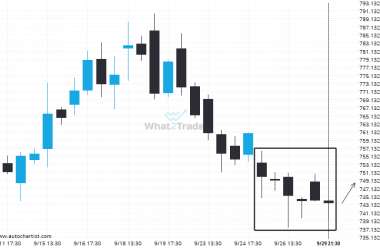
META recorded 6 consecutive 4 hour bearish candles reaching 743.4800.
META experienced an unusual number of bearish candles on the 4 hour timeframe.
Important price line being approached by BIDU. This price has been tested numerous times before.
BIDU is approaching a resistance line at 138.5250. If it hits the resistance line, it may break through…

