An unexpected large move has occurred on UK100 Daily chart beginning at 7813.0 and ending at 8441.0. Is this a sign of something new? What can we expect in the future?
Related Posts
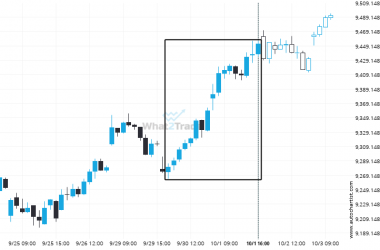
FTSE 100 reached 9451.85 after a 1.84% move spanning 2 days.
FTSE 100 recorded a considerable move in the last day — one of its biggest in recent sessions.
Big bullish swing on DAX 40 – this may be one of its more notable movements in the recent session.
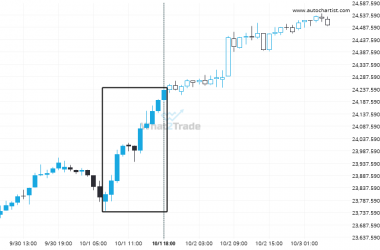
DAX 40 reached 24232.6 after a 1.77% move spanning 11 hours.
DOW 30 is signaling a possible trend reversal on the intraday charts with price not breaching resistance.
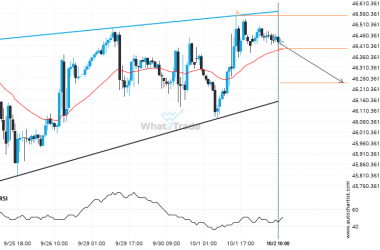
DOW 30 was identified at around 46395.84 having recently rebounded of the resistance on the 1 hour data…


