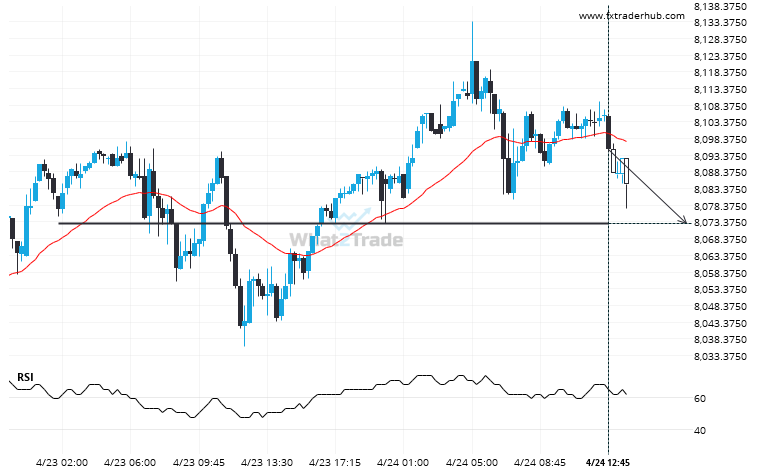
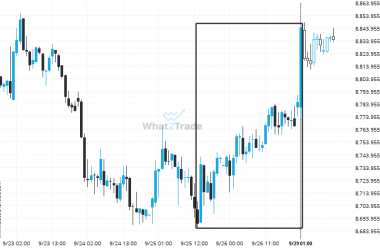
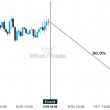
UK100 is approaching a support line at 8073.0000. If it hits the support line, it may break through this level to continue the bearish trend, or it may turn around back to current levels.
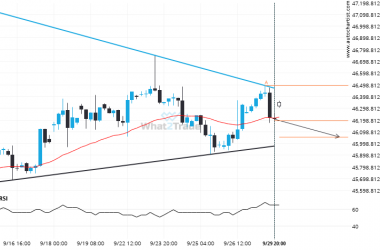
Related Posts
Rare bullish streak on the ASX 200 Daily chart.
ASX 200 posted a high rate of consecutive bullish candles on the Daily chart.
After testing 7892.2002 numerous times, CAC 40 has finally broken through. Can we expect a bullish trend to follow?
CAC 40 has broken through 7892.2002 which it has tested numerous times in the past. We have seen…
US 500 through 6451.963030303029. Is this a confirming a breakout? Will it continue its path in the current trend toward 6406.5663?
This trade setup on US 500 is formed by a period of consolidation; a period in which the…