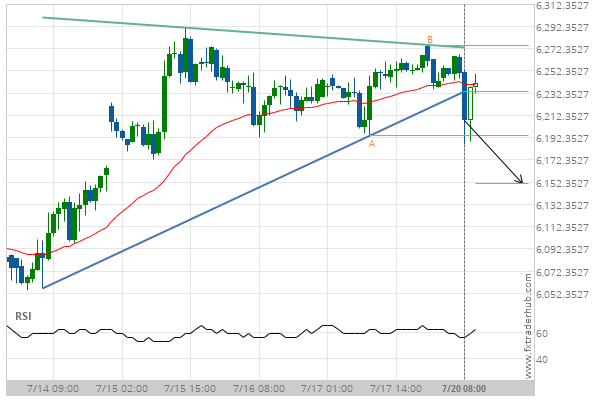
UK100 has broken through the support line of a Triangle. It has touched this line at least twice in the last 7 days. This breakout indicates a potential move to 6150.8683 within the next 2 days. Because we have seen it retrace from this positions in the past, one should wait for confirmation of the breakout before trading.
Related Posts
Supports and resistances are primary concepts of technical analysis. DAX 40 is heading for an important price of 23798.8008 – read about what this could mean for the future.
A strong support level has been identified at 23798.8008 on the 30 Minutes DAX 40 chart. DAX 40…
Breach of resistance could mean a start of a bullish trend on CAC 40
Triangle pattern identified on CAC 40 has broken through a resistance level with the price momentum continuing to…
Important price line being approached by FTSE 100. This price has been tested numerous times before.
FTSE 100 is moving towards a key support level at 9090.7998. FTSE 100 has previously tested this level…