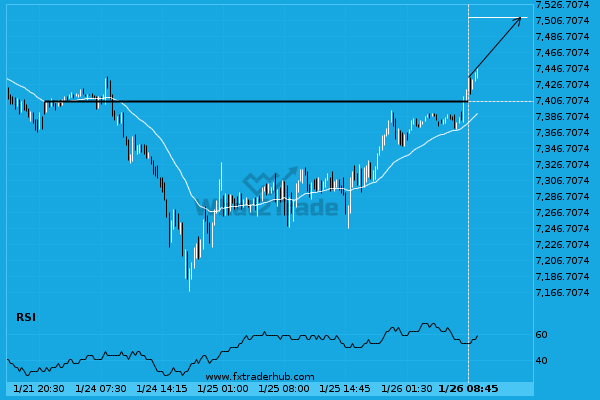
UK100 has broken through a resistance line. It has touched this line numerous times in the last 3 days. This breakout shows a potential move to 7509.6499 within the next 11 hours. Because we have seen it retrace from this level in the past, one should wait for confirmation of the breakout.
Related Posts
Nikkei 225 through 37689.35294117647. Is this a confirming a breakout? Will it continue its path in the current trend toward 38106.6602?
Nikkei 225 has broken through a resistance line of a Triangle chart pattern. If this breakout holds true,…
Supports and resistances are primary concepts of technical analysis. Nikkei 225 is heading for an important price of 37699.0000 – read about what this could mean for the future.
Nikkei 225 is moving towards a key resistance level at 37699.0000. This is a previously tested level for…
An unexpected large move has occurred on FTSE 100 Daily chart! Is this a sign of something new? What can we expect?
For those of you that don’t believe in trends, this may be an opportunity to take advantage of…