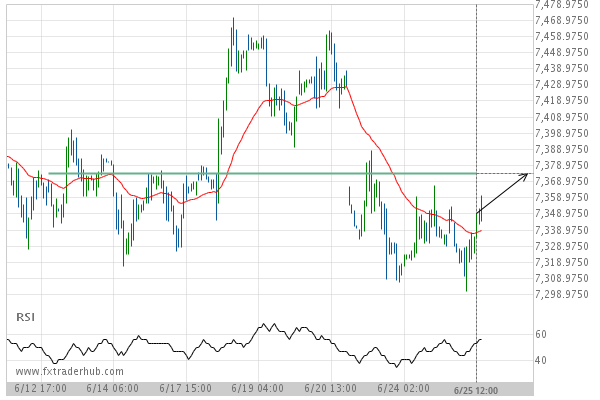
UK100 is moving towards the resistance line of a Resistance. Because we have seen it retrace from this positions in the past, we could see either a break through this line, or a rebound back to current lines. It has touched this line numerous times in the last 13 days and may test it again within the next 2 days.
Related Posts
FTSE 100 – approaching a price line that has been previously tested numerous times in the past
A strong resistance level has been identified at 8791.4502 on the 4 hour FTSE 100 chart. FTSE 100…
ASX 200 is signaling a possible trend reversal on the intraday charts with price not breaching support.
Emerging Triangle detected on ASX 200 – the pattern is an emerging one and has not yet broken…
FTSE 100 likely to test 8510.9004 in the near future. Where to next?
A strong support level has been identified at 8510.9004 on the 1 hour FTSE 100 chart. FTSE 100…