Trailing stops use price action to determine when to exit the market.
The purpose of moving the stop is to reduce risk, eliminate risk and lock in profits.
Let’s go over the specific techniques.
X Candle High / X Candle Low Trailing Stop Technique
This technique uses a set amount of closed candles in the direction of the trade to determine where to move the stop loss.
A good number of candles for this technique is 2 or 3. The more candles you use, the more room you give the market to move. The lower number of candles you use, the more closely you are following price action. For this example, let’s use 3 candles.
For a BUY trade, you use the lowest low of the past 3 closed candles as the area to move your stop. In a SELL trade, you use the highest high of the past 3 closed candles as the area to move the stop. Whenever a candle closes there is the potential to move the stop. Only move the stop in the direction of the trade.
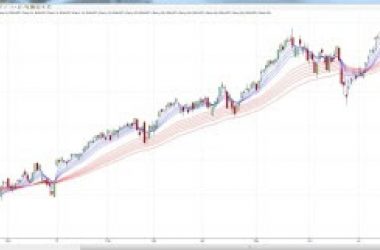
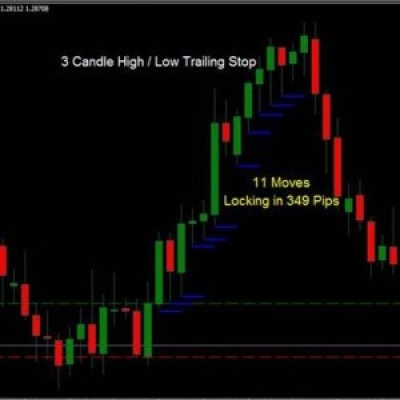
Here is an example of a BUY trade…

As you can see in the photo, you look at the last 3 closed candles and place your stop at the lowest low. Every time the lowest low of the last 3 candles goes in your favor, you move the stop to lock in more profits. In this example, the stop was moved 11 times before finally being stopped out with 349 pips.
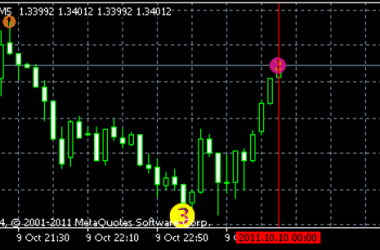
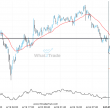
Here is an example of a sell trade..
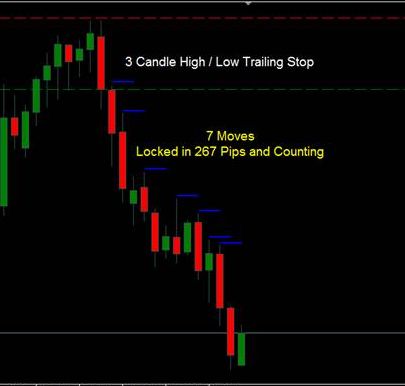
As you can see in the photo, you look at the last 3 closed candles and move the stop to the highest high. The stop loss was moved 7 times and locked in 267 pips of profit. Since the stop loss has not been hit yet, you would continue moving the stop in this fashion until the stop is hit.
Average True Range Trailing Stop
The Average True Range (ATR) indicator measures the volatility of the currency pair. If the degree of price volatility is high you will get a higher number. On the other hand, if there is not a large degree of price movement you will get a lower number. Many traders like to use the Average True Range to determine stop loss size, or how close to trail the stop.
The theory is, if you are in a volatile market, you’ll need a larger stop loss to keep from getting stopped out by random price movement. If the market is not volatile, you can get away with using a tighter stop. Traders use the average true range as is, or multiply the average true range by 1.25, 1.5, 2 or some other number.
The Average True Range trailing stop strategy is just like the X Pip strategy I talked about in the previous post. Once price goes in your favor, you move the stop based on the close of the candle. In this case, we use the average true range value, or a number based on the average true range multiplied by 1.25, 1.5, 2 or some other number. Every time another candle closes, there is a potential to move the stop loss if that means moving your stop in your favor.
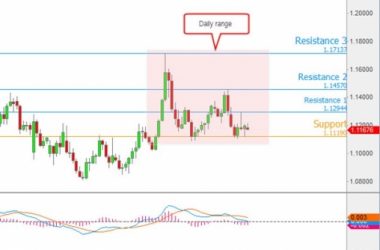
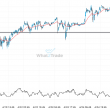
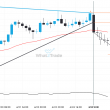
Here is a photo of the Average True Range…
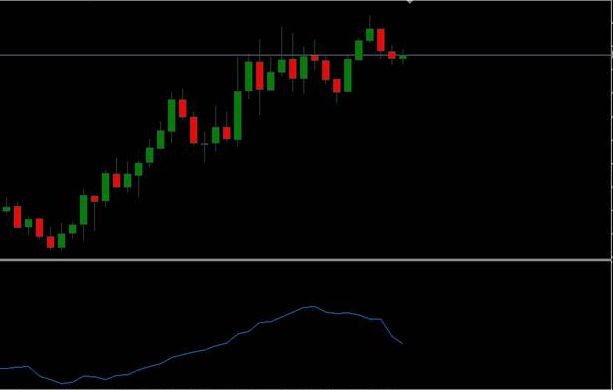
The Average True Range indicator is the blue line at the bottom. To find the value, put your cross-hairs on the line and look to the right to find the value. This is the value you use to calculate the trailing stop loss value. Ever time there is a closed candle, find the ATR value and figure out how close you want to trail the stop. If the value moves the stop in your favor, place the stop at that value.