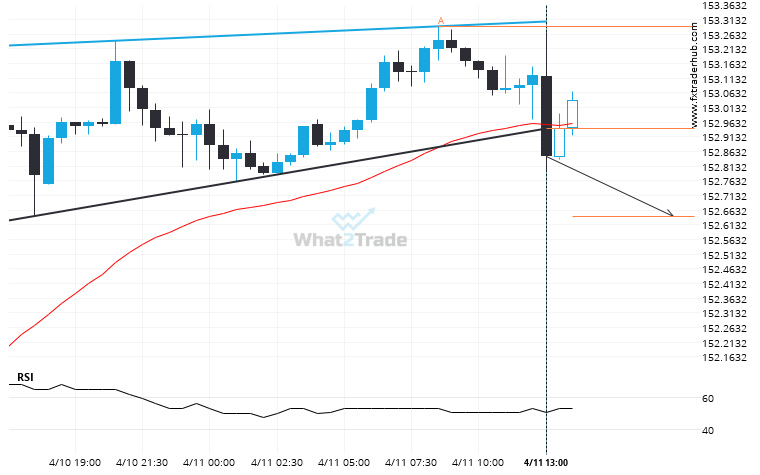
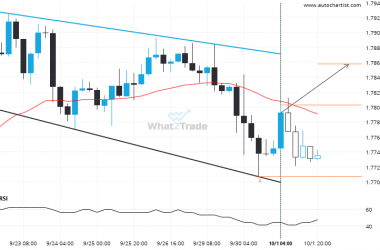
The last 21 30 Minutes candles on USD/JPY formed a Rising Wedge pattern and broken out through the pattern lines, indicating a possible bearish movement towards the price level of 152.6409.
Related Posts
Rare set of bearish consecutive candles on the AUDCAD Daily chart. Can we expect a turn-around?
AUDCAD has moved lower after 5 consecutive daily candles from 0.8928 to 0.8811 in the last 5 days.
EURAUD is approaching a support line of a Triangle. It has touched this line numerous times in the last 4 days.
EURAUD is moving towards a support line. Because we have seen it retrace from this line before, we…
Supports and resistances are primary concepts of technical analysis. GBPCHF is heading for an important price of 1.1138 – read about what this could mean for the future.
GBPCHF is moving towards a resistance line. Because we have seen it retrace from this level in the…