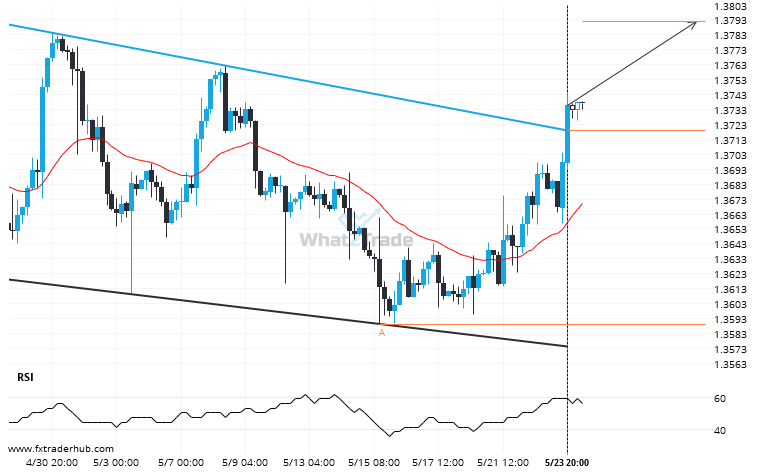
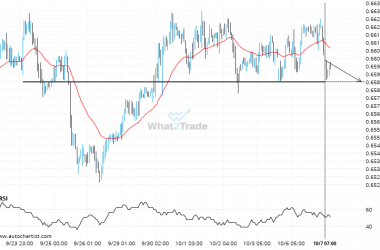
USD/CAD has broken through a resistance line of a Channel Down and suggests a possible movement to 1.3793 within the next 6 days. It has tested this line in the past, so one should probably wait for a confirmation of this breakout before taking action. If the breakout doesn’t confirm, we could see a retracement back to lines seen in the last 28 days.
Related Posts
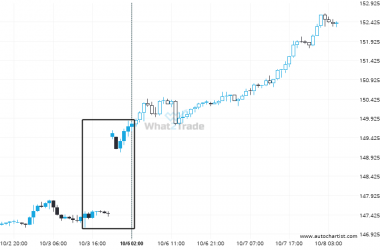
Extreme movement experienced on USDJPY. Check the chart to see what to do next.
USDJPY just posted a 1.58% move over the past 3 days – a move that won’t go unnoticed…
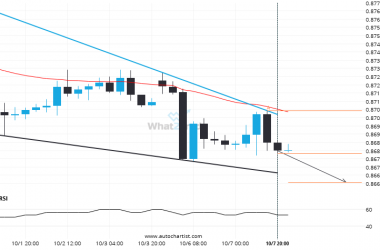
After testing the support line numerous times, EURGBP is once again approaching this line. Can we expect a bearish trend to follow?
EURGBP was identified at around 0.86786 having recently rebounded of the resistance on the 4 hour data interval.…
AUDUSD likely to test 0.6584 in the near future. Where to next?
AUDUSD is en route to a very important line that will be a definite deciding factor of what…


