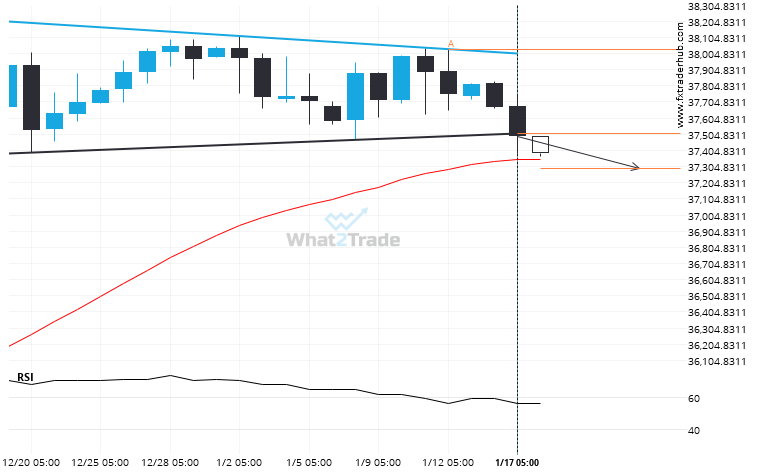
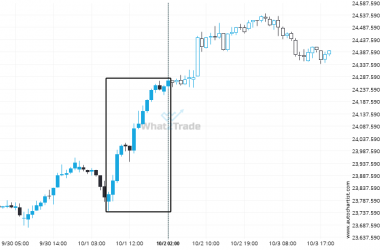
US30 moved through the support line of a Triangle at 37510.0 on the Daily chart. This line has been tested a number of times in the past and this breakout could mean an upcoming change from the current trend. It may continue in its current direction toward 37291.0940.
Related Posts
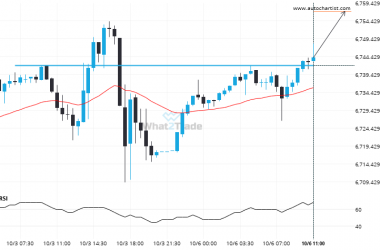
After testing 6741.8398 numerous times, US 500 has finally broken through. Can we expect a bullish trend to follow?
The price of US 500 in heading in the direction of 6757.0430. Despite the recent breakout through 6741.8398…
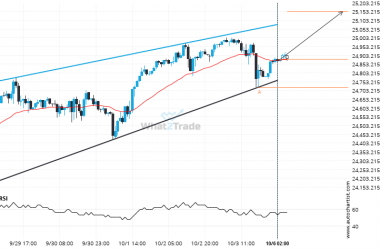
NAS 100 is approaching a resistance line of a Rising Wedge. It has touched this line numerous times in the last 11 days.
NAS 100 is heading towards the resistance line of a Rising Wedge. If this movement continues, the price…
A very large move was recorded on DAX 40. The size of the shift is exceptional.
A movement of 1.93% over 19 hours on DAX 40 doesn’t go unnoticed. You may start considering where…

