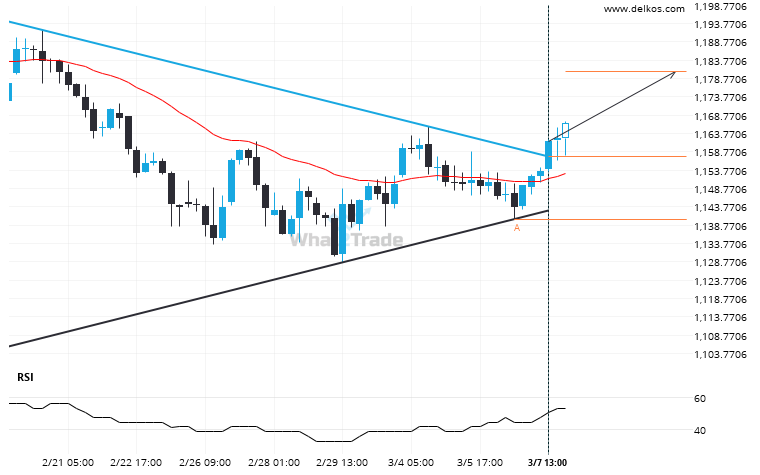
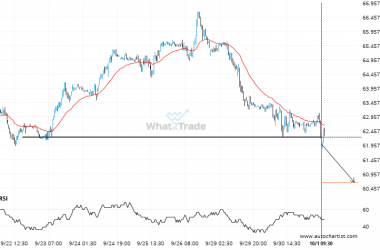
The last 32 4 hour candles on Soybeans May 2024 formed a Triangle pattern and broken out through the pattern lines, indicating a possible bullish movement towards the price level of 1180.5306.
Related Posts
Natural Gas – approaching a support line that has been previously tested at least twice in the past
The movement of Natural Gas towards the support line of a Channel Up is yet another test of…
Gold Spot is quickly approaching a very important level it has previously tested numerous times in the past
Gold Spot is moving towards a key resistance level at 3359.3501. Gold Spot has previously tested this level…
Because Gold Spot formed a Falling Wedge pattern, we expect it to touch the support line. If it breaks through support it may move much lower
An emerging Falling Wedge has been detected on Gold Spot on the 4 hour chart. There is a…