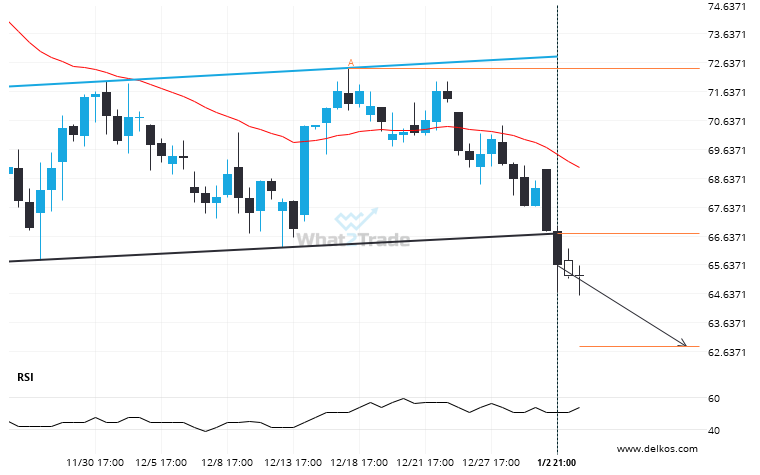
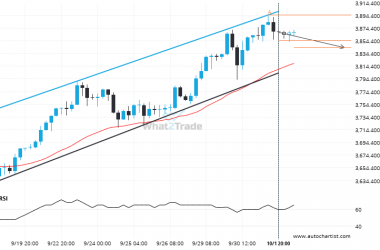
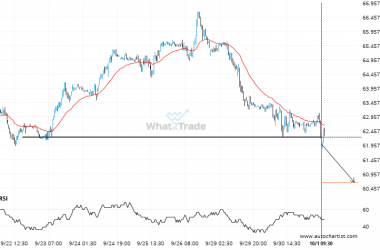
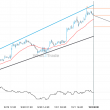
Lean Hogs February 2024 moved through the support line of a Rectangle at 66.70795454545454 on the 4 hour chart. This line has been tested a number of times in the past and this breakout could mean an upcoming change from the current trend. It may continue in its current direction toward 62.8028.
Related Posts
US Oil has broken through a resistance line. It has touched this line numerous times in the last 6 days.
US Oil has breached the resistance line at 63.3495. It may continue the bullish trend towards 64.1665, or,…
Natural Gas formed a Falling Wedge on the 4 hour chart. Retest of support in sight.
An emerging Falling Wedge has been detected on Natural Gas on the 4 hour chart. There is a…
US Oil may be on a start of a new bearish trend after its breakout through this important support level
US Oil has broken through a line of 62.6985 and suggests a possible movement to 62.2475 within the…