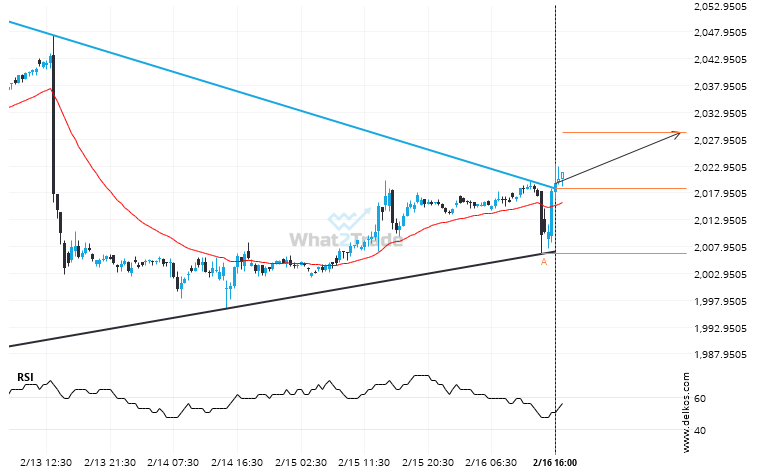
Gold April 2024 moved through the resistance line of a Triangle at 2018.6896296296293 on the 30 Minutes chart. This line has been tested a number of times in the past and this breakout could mean an upcoming change from the current trend. It may continue in its current direction toward 2029.1598.
Related Posts
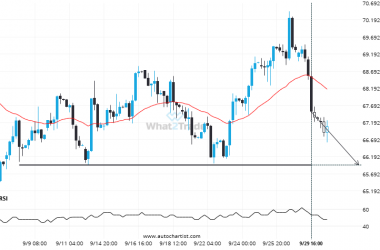
If you’re long Brent Crude you should be aware of the rapidly approaching level of 65.9405
The price of Brent Crude in heading back to the support area. It is possible that it will…
After testing the support line numerous times, Silver Spot is once again approaching this line. Can we expect a bearish trend to follow?
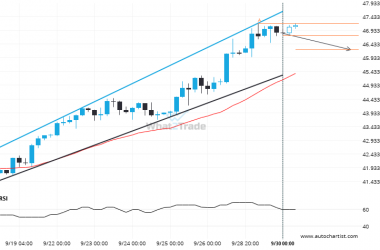
The movement of Silver Spot towards the support line of a Channel Up is yet another test of…
US Oil – Large moves like this tend to draw attention.
An unexpected large move occurred on US Oil 1 hour chart, starting at 65.5195 and reaching 63.2685. It…

