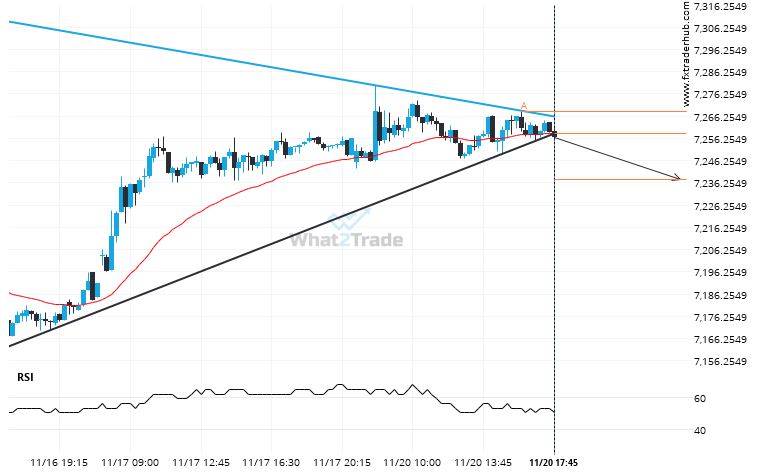
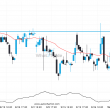
FRA40 has broken through a support line of a Triangle chart pattern. If this breakout holds true, we may see the price of FRA40 testing 7237.6756 within the next 9 hours. But don’t be so quick to trade, it has tested this line in the past, so you should confirm the breakout before taking any action.
Related Posts
ASX 200 seems to be on its way to resistance – a possible opportunity?
ASX 200 is moving towards a resistance line. Because we have seen it retrace from this level in…
DAX 40 hits 22384.2 after a 4.55% move spanning 15 days
DAX 40 has experienced an extremely big movement in last 14 days. It may continue the trend, but…
Nikkei 225 hits 35734.0000 after a run of 6 consecutive daily candles spanning 8 days.
Rare set of consecutive candles on the Nikkei 225 Daily chart. Could we expect a turn around from…