Browsing Tag
Triangle
1703 posts
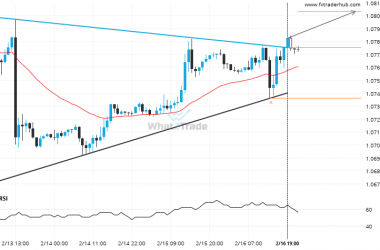
EUR/USD – breach of a trending resistance line that has been tested at least twice before.
EUR/USD has broken through a resistance line. It has touched this line at least twice in the last…
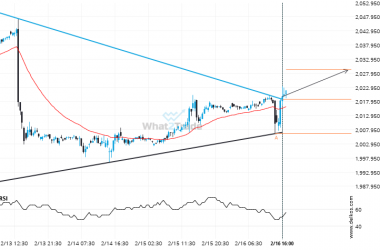
There is a possibility of a big movement on Gold April 2024 after a breach of the resistance
Gold April 2024 moved through the resistance line of a Triangle at 2018.6896296296293 on the 30 Minutes chart.…
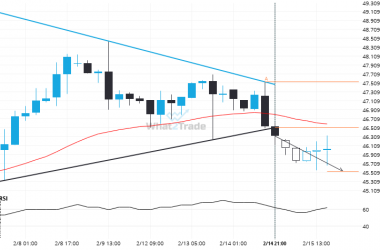
Breach of support could mean a start of a bearish trend on Soybean Oil March 2024
Soybean Oil March 2024 has broken through the support line which it has tested twice in the past.…
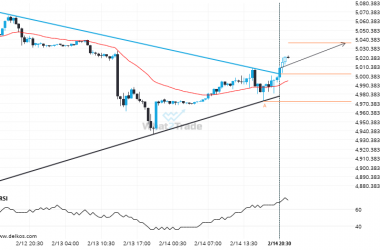
A possible move by E-Mini S&P 500 March 2024 towards 5036.2143
The breakout of E-Mini S&P 500 March 2024 through the resistance line of a Triangle could be a…
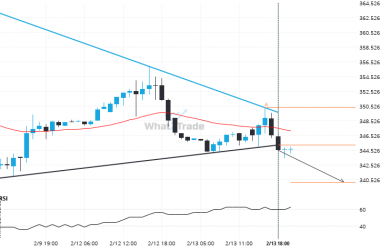
Bulls aim for 340.1698 after the Soybean Meal March 2024 triggered a bearish formation on the 1 hour chart
Soybean Meal March 2024 has broken through a support line of a Triangle and suggests a possible movement…
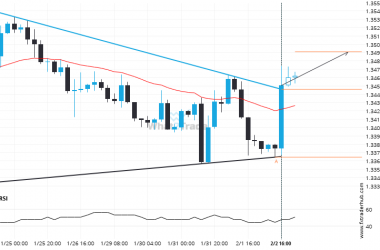
USD/CAD has broken out from the Triangle pattern. Expect it to hit 1.3492 soon.
Triangle pattern identified on USD/CAD has broken through a resistance level with the price momentum continuing to move…
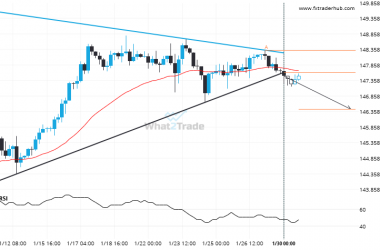
Bulls aim for 146.4242 after the USD/JPY triggered a bearish formation on the 4 hour chart
Triangle pattern identified on USD/JPY has broken through a support level with the price momentum continuing to move…
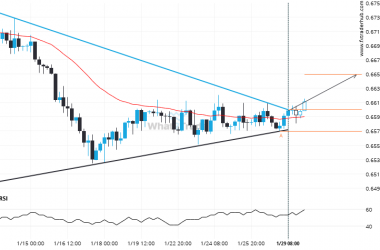
AUD/USD has broken through resistance of a Triangle. It has touched this line at least twice in the last 24 days.
The breakout of AUD/USD through the resistance line of a Triangle could be a sign of the road…
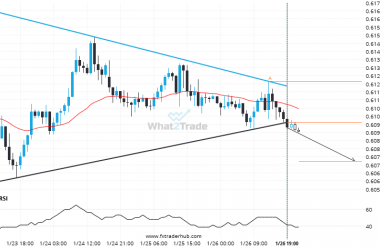
Breach of support could mean a start of a bearish trend on NZD/USD
NZD/USD moved through the support line of a Triangle at 0.60963328125 on the 1 hour chart. This line…
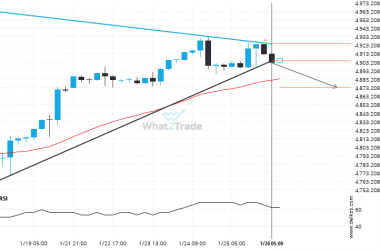
E-Mini S&P 500 March 2024 has broken through support of a Triangle. It has touched this line at least twice in the last 14 days.
This trade steup on E-Mini S&P 500 March 2024 is formed by a period of consolidation; a period…


