
Browsing Tag
Triangle
1703 posts
Soybeans MARCH 2023 a traversé la résistance d’un Triangle. Il a touché cette ligne au mois deux fois dans les 20 derniers jours.
Soybeans MARCH 2023 a franchi la ligne resistance. Il a touché cette ligne au moins deux fois au…

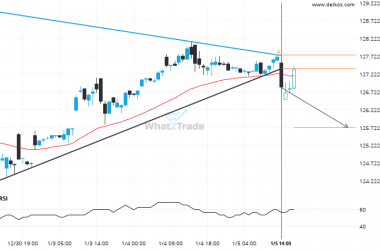
Support line breached by LTCUSD. This price has been tested at least twice before.
LTCUSD has broken through the support line which it has tested twice in the past. We have seen…
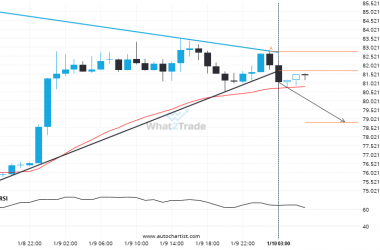
Ligne de tendance de support cassée par LTCUSD. Ce prix a déjà été testé au moins deux fois auparavant.
LTCUSD a franchi la ligne support qu’il a testé deux fois dans le passé. Nous l’avons déjà vu…
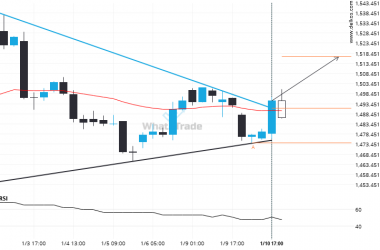
CORN MARCH 2023 – breach of a trending resistance line that has been tested at least twice before.
CORN MARCH 2023 has broken through the resistance line of a Triangle technical chart pattern. Because we have…

CORN MARCH 2023 – cassure d’une ligne de tendance de résistance qui avait déjà été testée au moins deux fois auparavant.
CORN MARCH 2023 a franchi la ligne resistance d’une configuration de graphique technique Triangle. Comme nous l’avons vu…
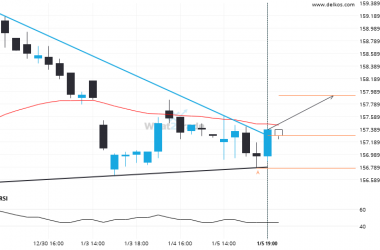
Resistance line breached by E-mini S&P 500 MARCH 2023. This price has been tested at least twice before.
E-mini S&P 500 MARCH 2023 has broken through the resistance line which it has tested twice in the…

Ligne de tendance de résistance cassée par E-mini S&P 500 MARCH 2023. Ce prix a déjà été testé au moins deux fois auparavant.
E-mini S&P 500 MARCH 2023 a franchi la ligne resistance qu’il a testé deux fois dans le passé.…
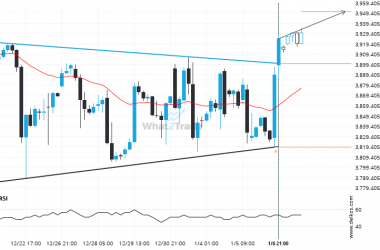
Breach of resistance could mean a start of a bullish trend on Live Cattle FEBRUARY 2023
Live Cattle FEBRUARY 2023 has broken through a resistance line of a Triangle chart pattern. If this breakout…

Une cassure de résistance pourrait indiquer le début d’une tendance haussière pour Live Cattle FEBRUARY 2023
Live Cattle FEBRUARY 2023 a franchi un niveau resistance représentant un Triangle. Si cette cassure se confirme, le…
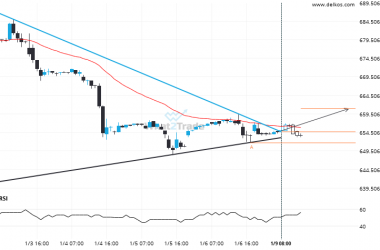
US Treasury Bond MARCH 2023 – breach of a trending support line that has been tested at least twice before.
US Treasury Bond MARCH 2023 has broken through the support line of a Triangle technical chart pattern. Because…