Browsing Tag
ES
684 posts
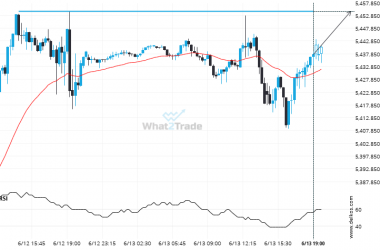
Will E-Mini S&P 500 June 2024 break through the resistance level it tested before?
E-Mini S&P 500 June 2024 is approaching a resistance line at 5454.5000. If it hits the resistance line,…
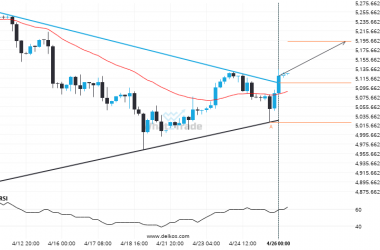
A possible move by E-Mini S&P 500 June 2024 towards 5193.8499
This trade setup on E-Mini S&P 500 June 2024 is formed by a period of consolidation; a period…
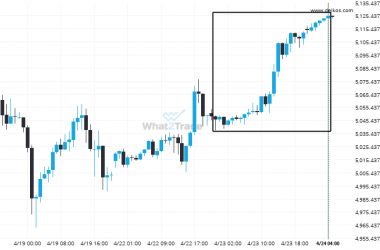
Could a large bullish move on E-Mini S&P 500 June 2024 be a sign of things to come?
E-Mini S&P 500 June 2024 has moved higher by 1.57% from 5046.0 to 5125.25 in the last 2…
Extreme movement experienced on E-Mini S&P 500 June 2024. Check this chart to see what to do next
E-Mini S&P 500 June 2024 has experienced an extremely big movement in last 6 hours. It may continue…
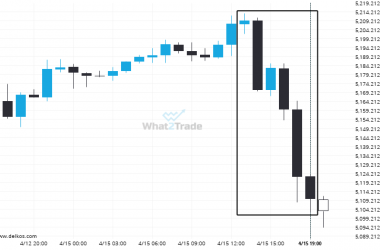
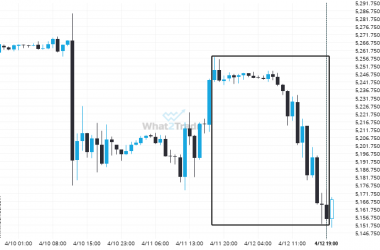
Could a large bearish move on E-Mini S&P 500 June 2024 be a sign of things to come?
E-Mini S&P 500 June 2024 has moved lower by 1.79% from 5249.25 to 5155.5 in the last 2…
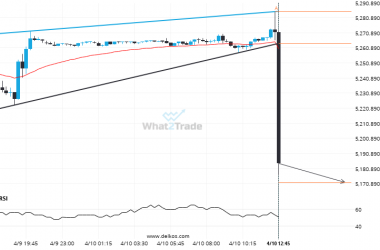
Breach of support could mean a start of a bearish trend on E-Mini S&P 500 June 2024
E-Mini S&P 500 June 2024 has broken through the support line of a Rising Wedge technical chart pattern.…
E-Mini S&P 500 June 2024 – breach of a trending support line that has been tested at least twice before.
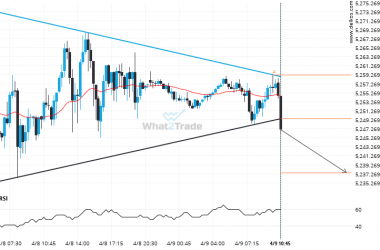
E-Mini S&P 500 June 2024 has broken through a support line of a Triangle and suggests a possible…
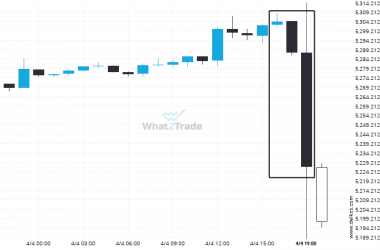
Could a large bearish move on E-Mini S&P 500 June 2024 be a sign of things to come?
E-Mini S&P 500 June 2024 hits 5226.5 after a 1.46% move spanning 3 hours.
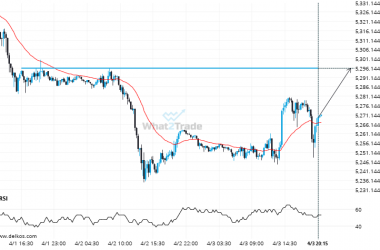
Will E-Mini S&P 500 June 2024 break through the resistance level it tested before?
E-Mini S&P 500 June 2024 is heading towards a line of 5296.2500. If this movement continues, the price…
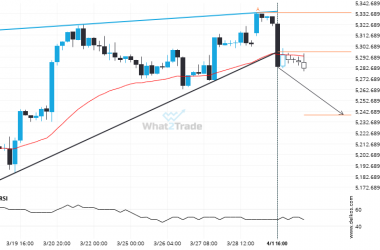
After testing support twice in the past, E-Mini S&P 500 June 2024 has finally broken through. Can we expect a bearish trend to follow?
The last 21 4 hour candles on E-Mini S&P 500 June 2024 formed a Rising Wedge pattern and…


