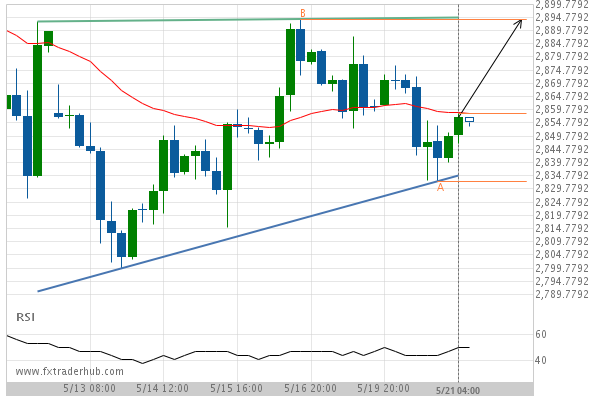
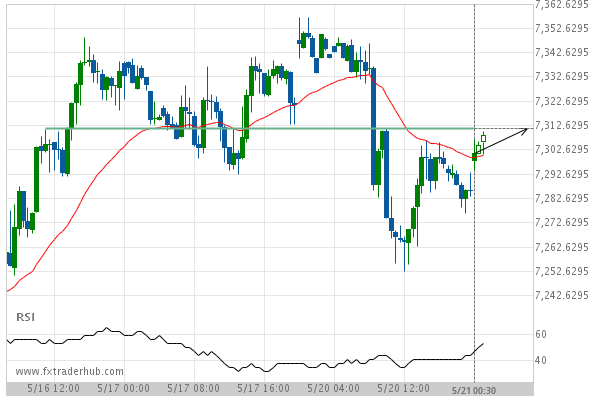
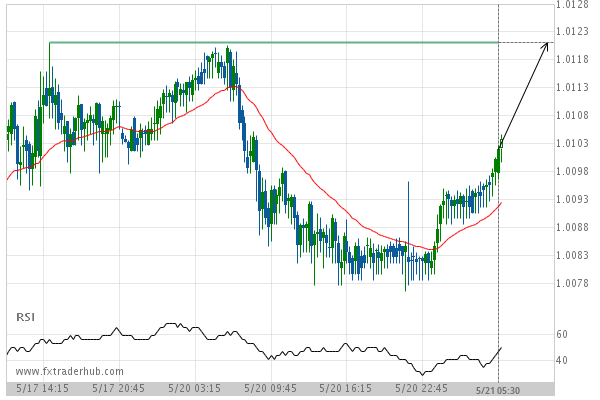
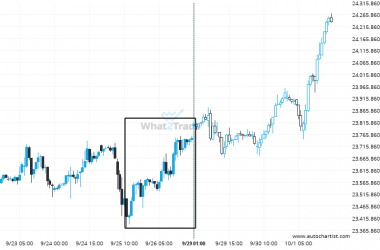
SPX500 is heading towards the resistance line of a Ascending Triangle. If this movement continues, we expect the price of SPX500 to test 2894.0000 within the next 3 days. But don’t be so quick to trade, it has tested this line numerous times in the past, so this movement could be short-lived and end up rebounding just like it did in the past.
Related Posts
DOW 30 is signaling a possible trend reversal on the intraday charts with price not breaching resistance.
DOW 30 was identified at around 46395.84 having recently rebounded of the resistance on the 1 hour data…
Nikkei 225 heading towards a price it has tested 5 times in the recent past.
A strong resistance level has been identified at 45777.0000 on the 15 Minutes Nikkei 225 chart. Nikkei 225…
Big bullish swing on DAX 40 – this may be one of its more notable movements in the recent session.
A movement of 1.66% over 4 days on DAX 40 doesn’t go unnoticed. You may start considering where…

