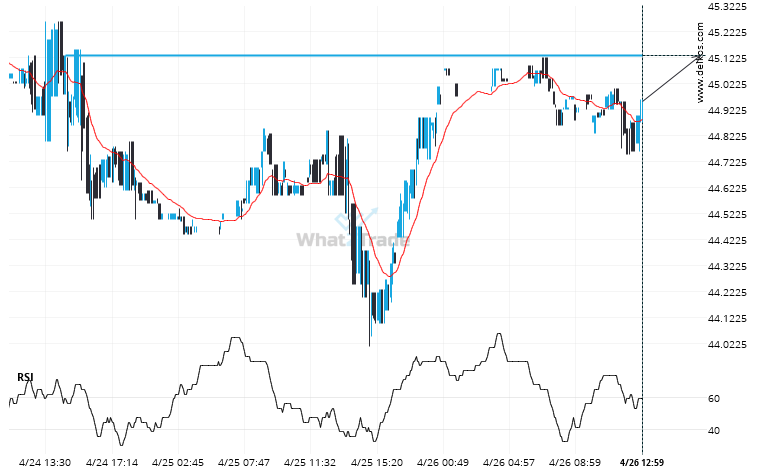
A strong resistance level has been identified at 45.1300 on the 15 Minutes Soybean Oil May 2024 chart. Soybean Oil May 2024 is likely to test it soon.
Soybean Oil May 2024 seems to be on its way to resistance – a possible opportunity?

A strong resistance level has been identified at 45.1300 on the 15 Minutes Soybean Oil May 2024 chart. Soybean Oil May 2024 is likely to test it soon.