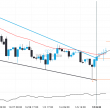
Falling Wedge pattern identified on Soybean Oil March 2024 has broken through a resistance level with the price momentum continuing to move in an upward direction. A solid trading opportunity continues with the price expected to reach 49.1694 in the next 3.
Related Posts
If you’re long Natural Gas you should be aware of the rapidly approaching level of 3.4305
A strong support level has been identified at 3.4305 on the 15 Minutes Natural Gas chart. Natural Gas…
US Oil is signaling a possible trend reversal on the intraday charts with price not breaching resistance.
A Channel Up pattern was identified on US Oil at 61.7135, creating an expectation that it may move…
Gold Spot through 3225.946052631579. Is this a confirming a breakout? Will it continue its path in the current trend toward 3282.6858?
Gold Spot has broken through the resistance line which it has tested twice in the past. We have…