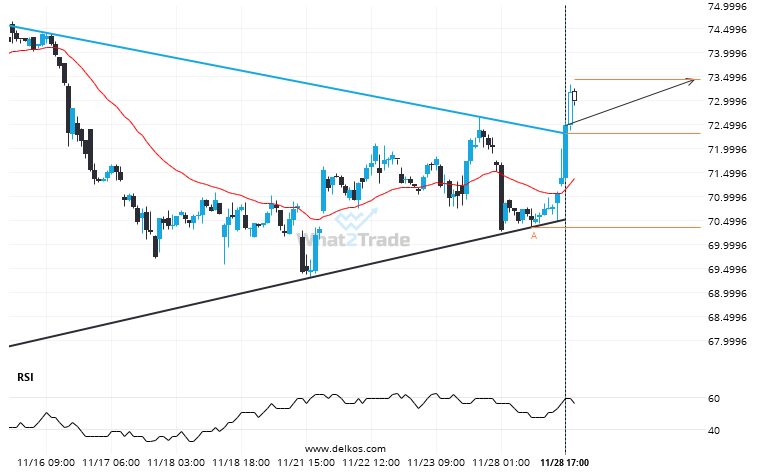
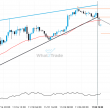
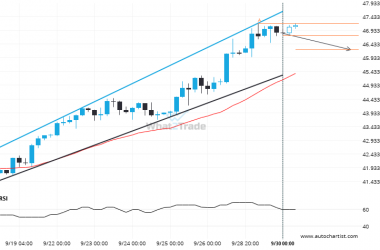
Soybean Oil JANUARY 2023 has broken through the resistance line of a Triangle technical chart pattern. Because we have seen it retrace from this line in the past, one should wait for confirmation of the breakout before taking any action. It has touched this line twice in the last 15 days and suggests a possible target level to be around 73.4521 within the next 2 days.
Related Posts
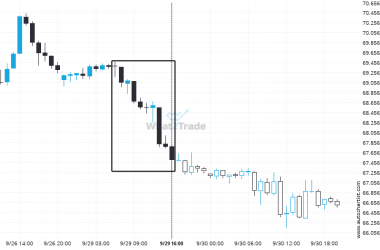
An unexpected large move occurred on Brent Crude 1 hour chart. The shift stands out in recent activity.
Brent Crude just posted a 2.7% move over the past 10 hours – a move that won’t go…
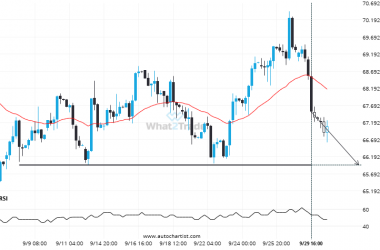
If you’re long Brent Crude you should be aware of the rapidly approaching level of 65.9405
The price of Brent Crude in heading back to the support area. It is possible that it will…
After testing the support line numerous times, Silver Spot is once again approaching this line. Can we expect a bearish trend to follow?
The movement of Silver Spot towards the support line of a Channel Up is yet another test of…

