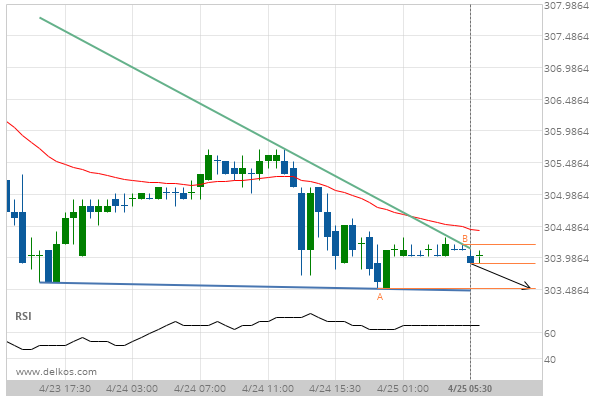
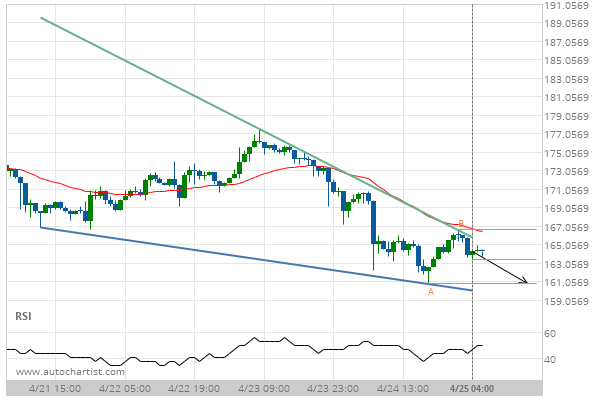
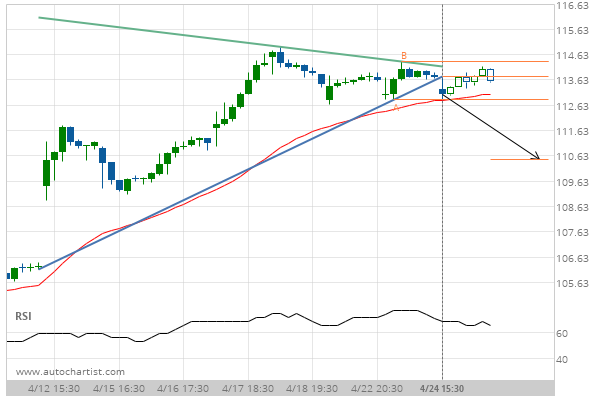
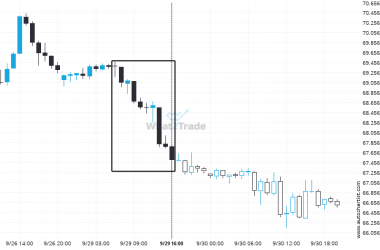
Descending Triangle identified at 25-Apr-2019 05:30 UTC. This pattern is still in the process of forming. Possible bearish price movement towards the support 303.5000 within the next 8 hours.
Related Posts
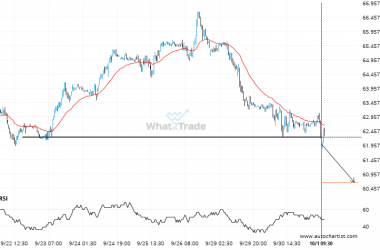
US Oil is currently testing a level of 62.2340. Will the breakout continue or will things reverse?
US Oil has broken through 62.2340 which it has tested numerous times in the past. We have seen…
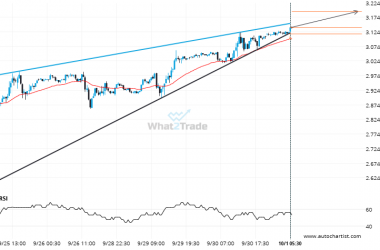
A Rising Wedge has formed, Natural Gas is approaching support. Can we expect a breakout and the start of a new trend or a reversal?
Natural Gas was identified at around 3.1395 having recently rebounded of the support on the 30 Minutes data…
An unexpected large move occurred on Brent Crude 1 hour chart. The shift stands out in recent activity.
Brent Crude just posted a 2.7% move over the past 10 hours – a move that won’t go…

