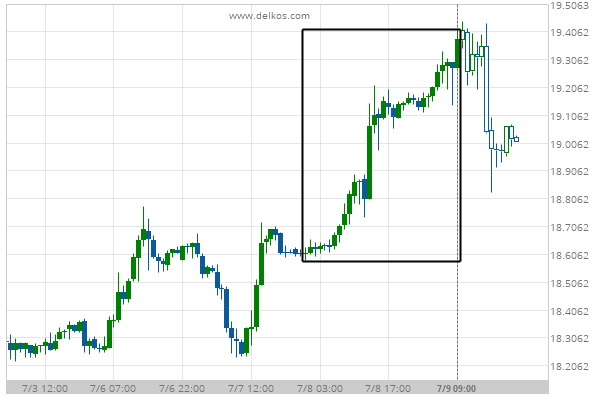
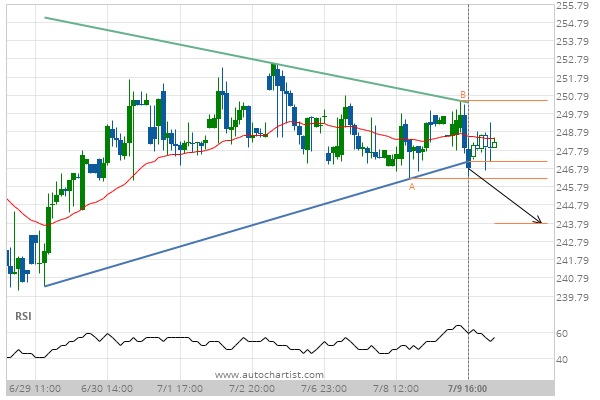
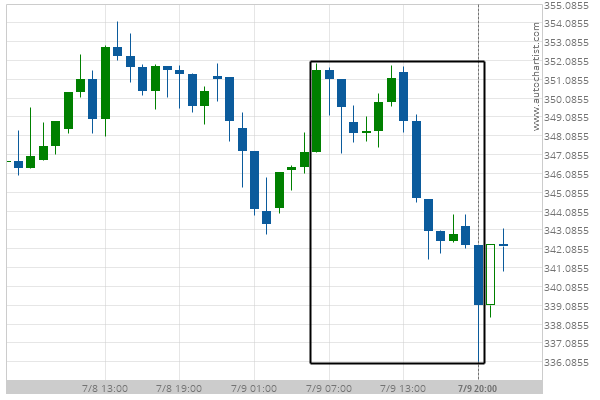
A movement of 4.14% over 2 days on Silver SEPTEMBER 2020 doesn’t go unnoticed. You may start considering where it’s heading next, a continuation of the current upward trend, or a reversal in the previous direction.
Related Posts
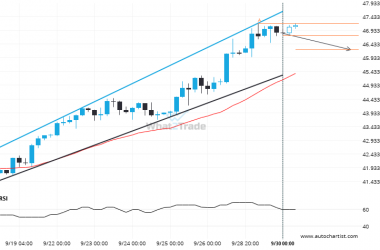
After testing the support line numerous times, Silver Spot is once again approaching this line. Can we expect a bearish trend to follow?
The movement of Silver Spot towards the support line of a Channel Up is yet another test of…
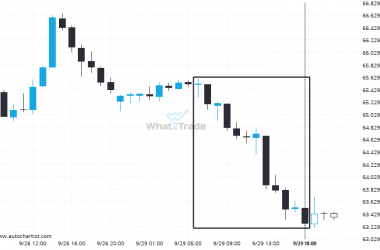
US Oil – Large moves like this tend to draw attention.
An unexpected large move occurred on US Oil 1 hour chart, starting at 65.5195 and reaching 63.2685. It…
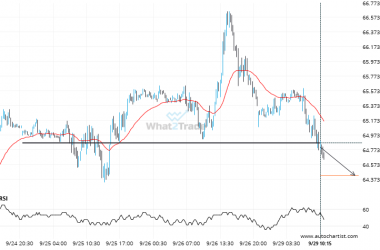
Breach of 64.8690 could mean a start of a bearish trend on US Oil
US Oil has broken through 64.8690 which it has tested numerous times in the past. We have seen…

