Day trading is challenging. Don’t let anyone tell you otherwise. The odds are stacked against you, and the risk of loss lurks at every turn. That’s why it’s important to understand the ground rules of day trading.
Start with your Range
One of the most common mistakes with day trading is failing to identify the daily range. For example, say you’re planning to take a long on the EUR/USD. However, the pair has already moved above its average daily range. What might be the result? Your trade could be doomed as the market gravitates into its average range.
When you trade for a few hours, most of the signals you count on are a few hours old. This means, essentially, that the signals are naturally soft and fluid. Markets tend to gravitate towards its range, especially on an intraday interval. Thus fluid signals tend to be much less reliable.
Knowing the range of the interlay trade can lower your risk of loss. Moreover, used in your favour, it could also improve your gains.
Determining the Range.
There are many techniques to identify the true range, including the Moving Standard Deviation or Bollinger Bands. However, those techniques tend to be more effective in swing trading. Therefore, I always recommend starting with what I call the top to bottom approach when day trading.
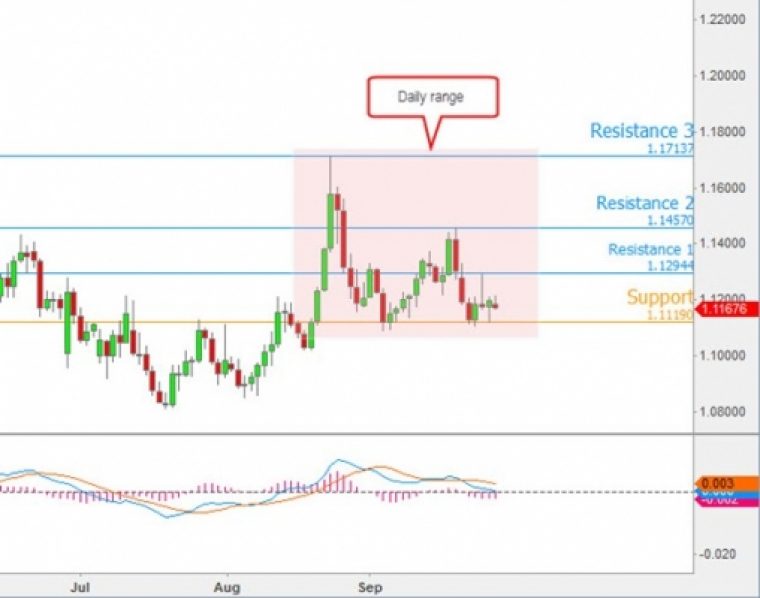
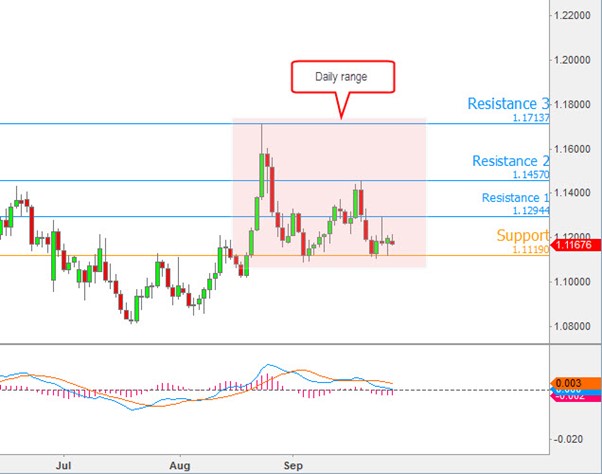
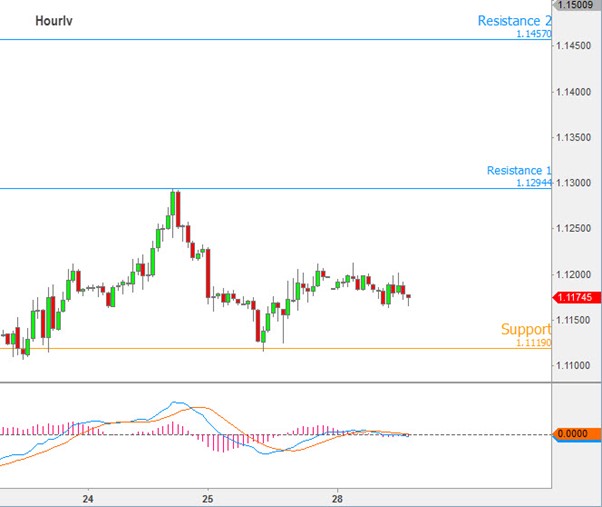
That is a method to identify your support and resistance levels in higher intervals, say, daily. Daily is ideal because it’s two levels up, compared to just hourly. Then you apply those levels on an hourly trade. What you get are solid levels you can count on rather than the fluid hourly support levels.
A Practical Example
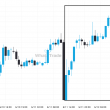
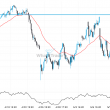
This is a chart we used to identify the daily range. Now, we drill down into our desired interval. This chart shows the hourly interval, where we can get reliable resistance and support levels for either shorts or longs.
Get In and Out Quickly
You should never stay in a trade longer than you have to; that’s clear and common sense. This method can be more forgiving in longer duration trades, e.g., multi-days to several weeks. However, in day trading, when trades are counted by the minute, then every minute counts.
Spend too long at a trade, and there can be dire consequences. The already unreliable market at such low intervals could turn against you. And the chances this could continue to grow the longer your trade is open. Hence, you should always concentrate on minimizing the time your trade is open while maintaining a worthwhile profit.
Final Preparation
Before implementing these rules into your daily trading strategy, make sure your limit per trade is much smaller than the daily range. Why? As you approach the daily resistance/support level, the odds start to turn against you. There is a greater likelihood that the market will turn around before your position has reached its “full potential.”
Trade small and target prices that are well within the daily range. That way, you improve your chance of hitting that “home run” and profiting from your position.
The Trend is Not your Friend
Of course, we’re all familiar with the old adage “the trend is your friend.” Well, to that I say if the trend’s a friend, then who needs enemies? There’s a rule of thumb for day trading. If there’s a bullish long term trend (i.e. several weeks) and you’re trading a short then beware. The market will have a tendency to surge higher and move against you unexpectedly.
Implementing the Rules
Now, some day traders may simply avoid taking shorts in just such a scenario. Yet that doesn’t have to be the case. Instead, you might just take trades with significantly lower leverage. By doing so you balance out the risk associated with trading against the long term trend.

