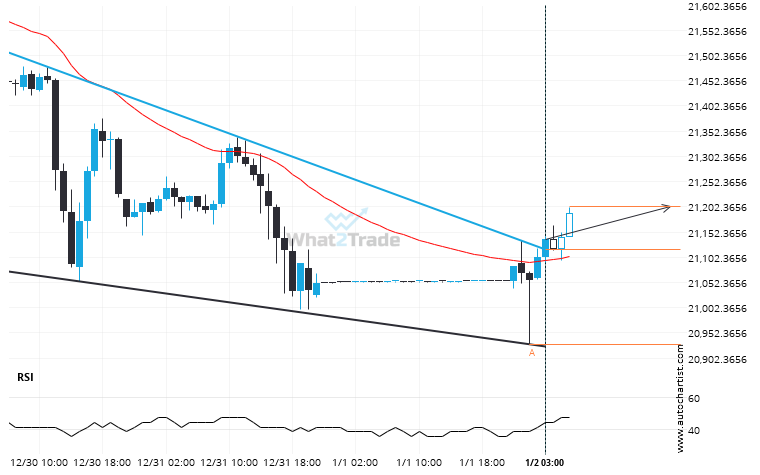
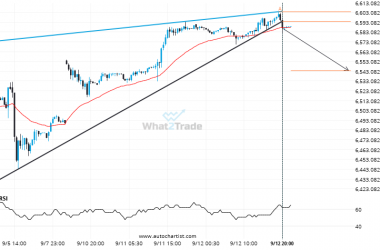
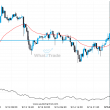
NAS 100 moved through the resistance line of a Falling Wedge at 21118.40289 on the 1 hour chart. This line has been tested a number of times in the past and this breakout could mean an upcoming change from the current trend. It may continue in its current direction toward 21203.0491.
Related Posts
Could a large bearish move on ASX 200 be a sign of things to come?
Those of you that are trend followers are probably eagerly watching ASX 200 to see if its latest…
A possible move on Nikkei 225 as it heads towards resistance
Nikkei 225 is approaching the resistance line of a Channel Up. It has touched this line numerous times…
If you’re short FTSE 100 you should be aware that 8791.4502 has just been breached – a level tested 3 time in the past
The price of FTSE 100 in heading in the direction of 8840.5146. Despite the recent breakout through 8791.4502…