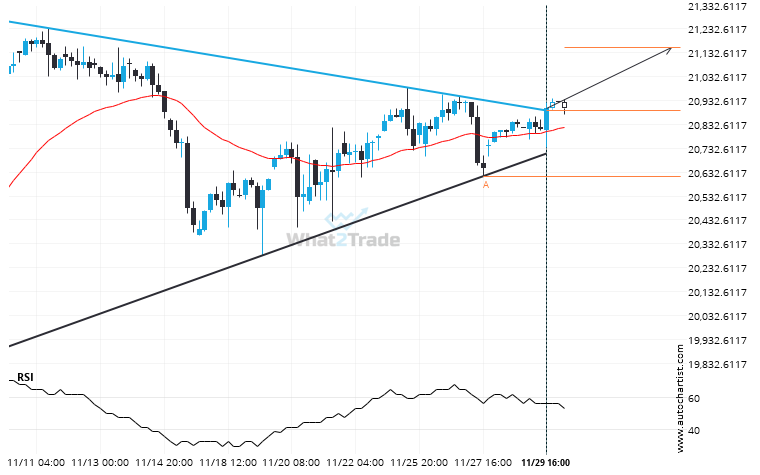
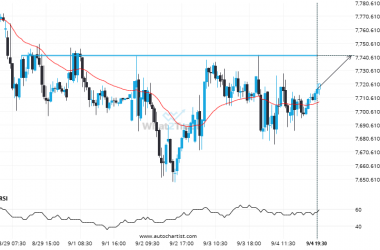
NAS 100 has broken through a resistance line of a Triangle chart pattern. If this breakout holds true, we may see the price of NAS 100 testing 21153.8310 within the next 3 days. But don’t be so quick to trade, it has tested this line in the past, so you should confirm the breakout before taking any action.
Related Posts
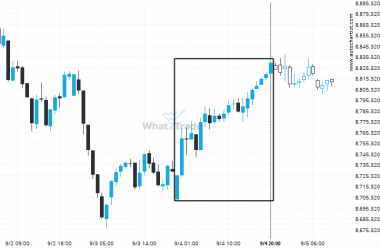
ASX 200 experienced a 1.19% bullish move in just 21 hours. The magnitude speaks for itself.
ASX 200 reached 8829.3 after a 1.19% move spanning 21 hours.
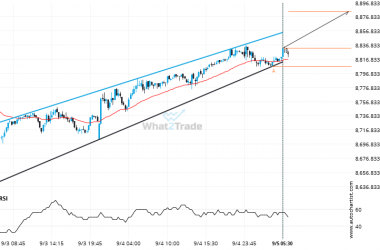
ASX 200 formed a Channel Up on the 15 Minutes chart. Retest of resistance in sight.
ASX 200 is moving towards a resistance line which it has tested numerous times in the past. We…
If CAC 40 touches 7741.7998 it may be time to take action.
The movement of CAC 40 towards 7741.7998 price line is yet another test of the line it reached…

