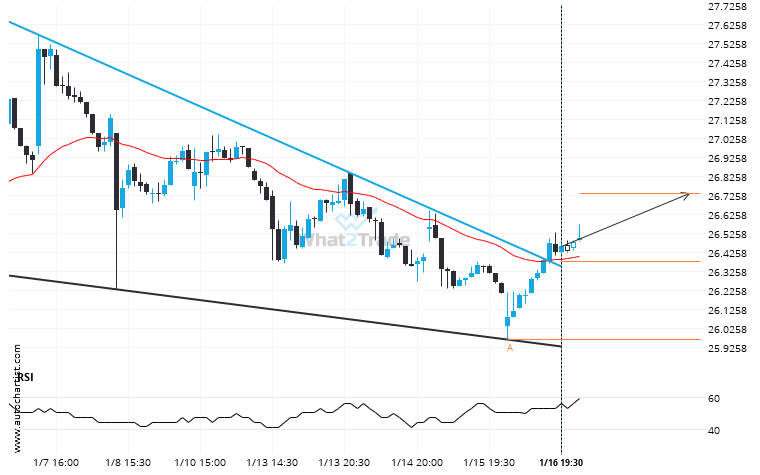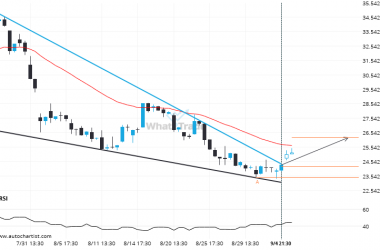
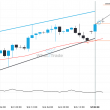
PFE moved through the resistance line of a Falling Wedge at 26.376730769230768 on the 30 Minutes chart. This line has been tested a number of times in the past and this breakout could mean an upcoming change from the current trend. It may continue in its current direction toward 26.7343.
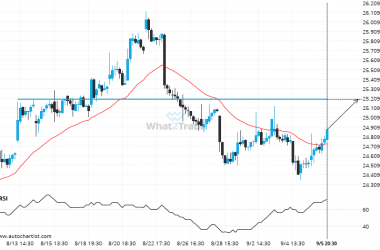
PFE broke through a resistance at 2025-01-16T21:00:00.000Z, with the price momentum continuing to move in an upward direction over the next hours, good opportunity presents itself with the price expected to reach 26.7343.