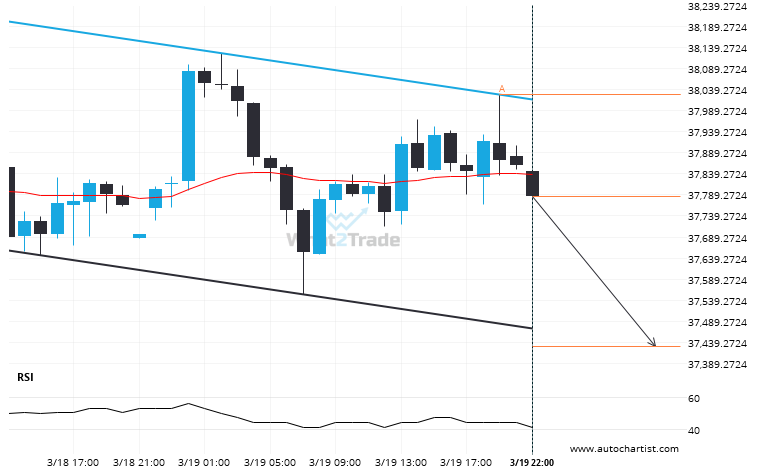
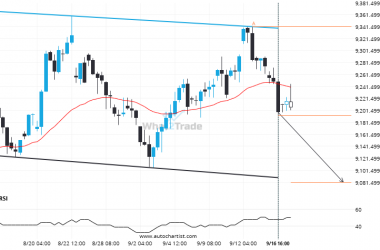
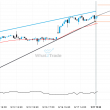
An emerging Channel Down has been detected on Nikkei 225 on the 1 hour chart. There is a possible move towards 37429.3750 next few candles. Once reaching resistance it may continue its bearish run or reverse back to current price levels.
Related Posts
Breach of 6008.0898 could mean a start of a bullish trend on US 500
US 500 has broken through 6008.0898 which it has tested numerous times in the past. We have seen…
Is the extremely large movement on FTSE 100 a sign of things to come?
Those of you that are trend followers are probably eagerly watching FTSE 100 to see if its latest…
DOW 30 – approaching a support line that has been previously tested at least twice in the past
A Channel Up pattern was identified on DOW 30 at 42696.4, creating an expectation that it may move…