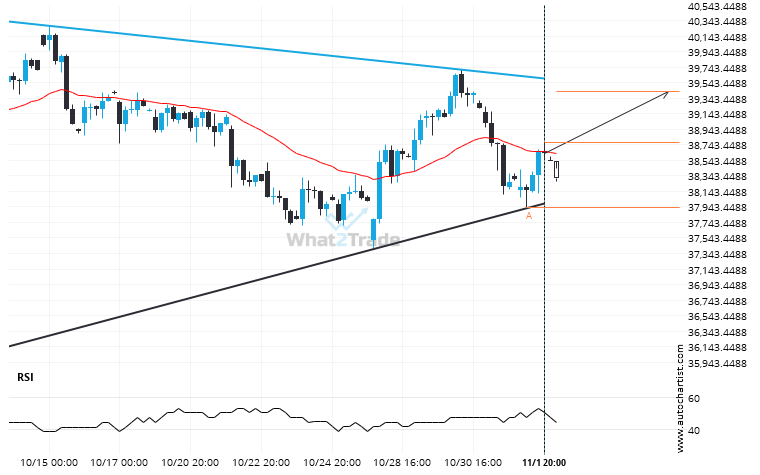
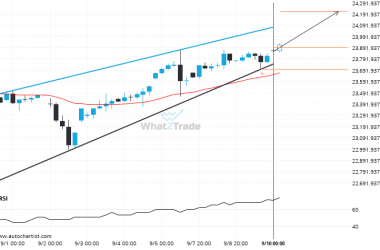
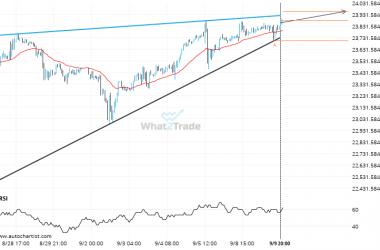
A Triangle pattern was identified on Nikkei 225 at 38767.0, creating an expectation that it may move to the resistance line at 39423.5000. It may break through that line and continue the bullish trend or it may reverse from that line.
Related Posts
NAS 100 – approaching a resistance line that has been previously tested at least twice in the past
Emerging Rising Wedge detected on NAS 100 – the pattern is an emerging one and has not yet…
DOW 30 heading towards a price it has tested 3 times in the recent past.
DOW 30 is heading towards a line of 45773.9102. If this movement continues, the price of DOW 30…
NAS 100 – approaching a resistance line that has been previously tested at least twice in the past
Emerging Rising Wedge pattern in its final wave was identified on the NAS 100 1 hour chart. After…


