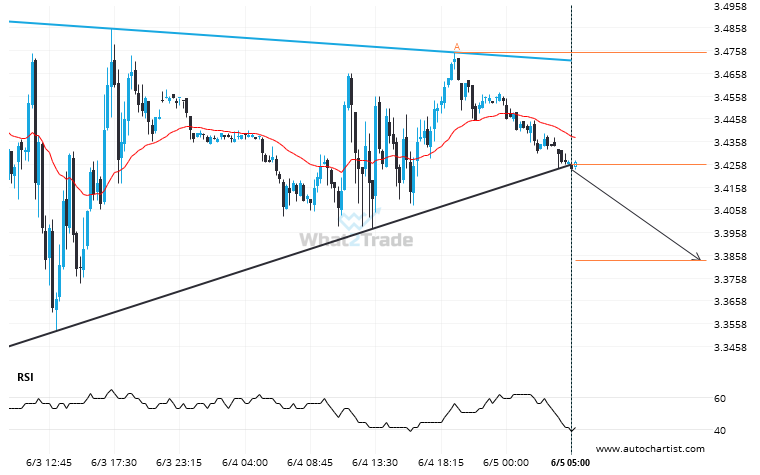
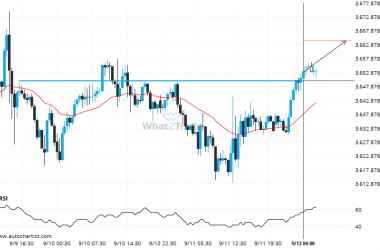
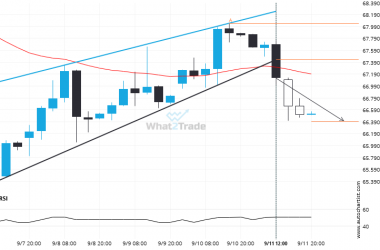
Natural Gas has broken through a support line of a Triangle chart pattern. If this breakout holds true, we may see the price of Natural Gas testing 3.3833 within the next 12 hours. But don’t be so quick to trade, it has tested this line in the past, so you should confirm the breakout before taking any action.
Natural Gas through 3.425869565217391. Is this a confirming a breakout? Will it continue its path in the current trend toward 3.3833?