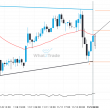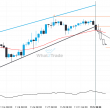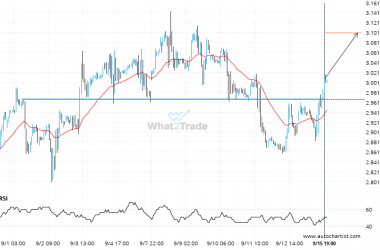
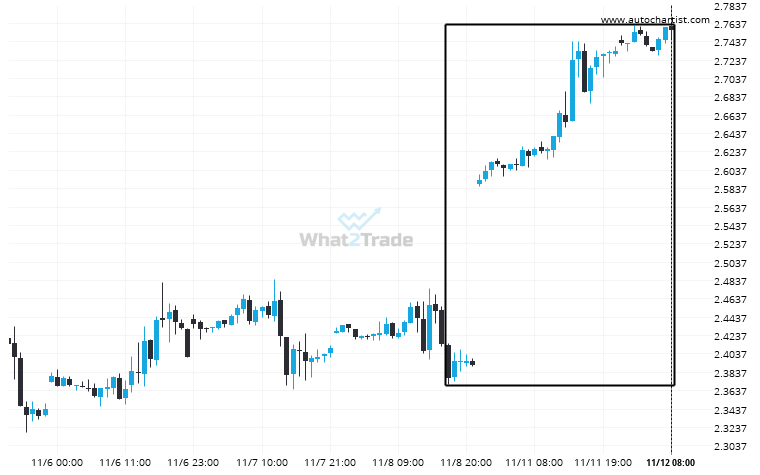
An unexpected large move has occurred on Natural Gas 1 hour chart beginning at 2.3765 and ending at 2.756. Is this a sign of something new? What can we expect in the future?
Natural Gas hits 2.756 after a 15.97% move spanning 4 days

An unexpected large move has occurred on Natural Gas 1 hour chart beginning at 2.3765 and ending at 2.756. Is this a sign of something new? What can we expect in the future?