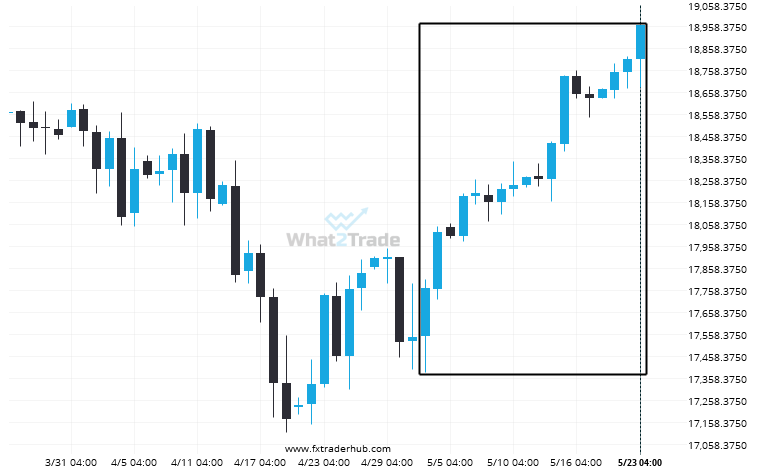
A movement of 6.73% over 22 days on NAS100 doesn’t go unnoticed. You may start considering where it’s heading next, a continuation of the current upward trend, or a reversal in the previous direction.
Related Posts
CAC 40 seems to be on its way to resistance – a possible opportunity?
CAC 40 is heading towards a line of 7845.1001. If this movement continues, the price of CAC 40…
FTSE 100 moves higher to 8830.28 in the last 65 days.
FTSE 100 hits 8830.28 after a 15.02% move spanning 65 days.
Because CAC 40 formed a Triangle pattern, we expect it to touch the resistance line. If it breaks through resistance it may move much higher
CAC 40 is approaching the resistance line of a Triangle. It has touched this line numerous times in…