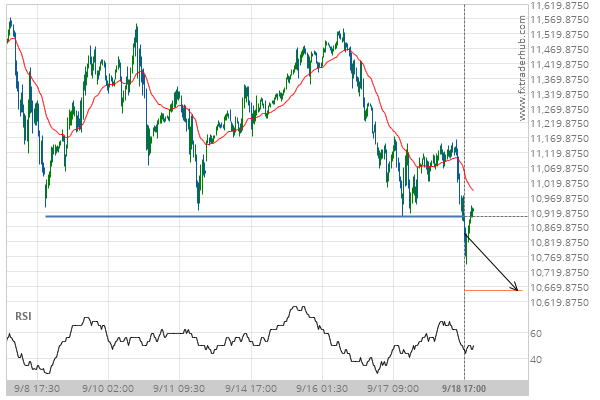
NAS100 has broken through the support line of a Support. It has touched this line numerous times in the last 10 days. This breakout shows a potential move to 10656.5000 within the next 2 days. Because we have seen it retrace from this position in the past, one should wait for confirmation of the breakout before trading.
Related Posts
NAS 100 recorded 5 consecutive 4 hour bullish candles over 20 hours.
NAS 100 experienced a high number of bullish candles reaching 23523.3633 over 20 hours.
After testing 42973.0000 numerous times, Nikkei 225 is once again approaching this price point. Can we expect a bullish trend to follow?
Nikkei 225 is moving towards a key resistance level at 42973.0000. This is a previously tested level for…
Important resistance line being approached by FTSE 100. This price has been tested numerous time in the last 8 days
FTSE 100 is heading towards the resistance line of a Rising Wedge. If this movement continues, the price…