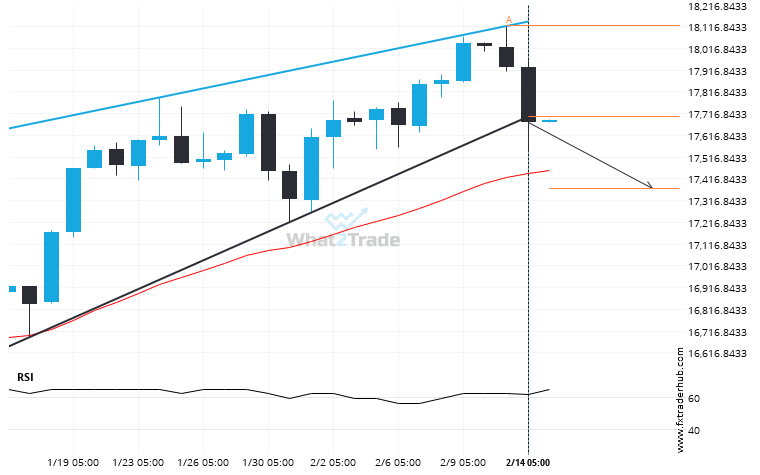
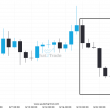
NAS100 moved through the support line of a Rising Wedge at 17703.903846153844 on the Daily chart. This line has been tested a number of times in the past and this breakout could mean an upcoming change from the current trend. It may continue in its current direction toward 17370.7197.
Related Posts
A Channel Up has formed, DAX 40 is approaching support. Can we expect a breakout and the start of a new trend or a reversal?
A Channel Up pattern was identified on DAX 40 at 24109.4, creating an expectation that it may move…
FTSE 100 keeps moving closer towards 8814.3701. Will it finally breach this level?
FTSE 100 is approaching a resistance line at 8814.3701. If it hits the resistance line, it may break…
Important support line being approached by FTSE 100. This price has been tested numerous time in the last 7 days
FTSE 100 is trapped in a Falling Wedge formation, implying that a breakout is Imminent. This is a…