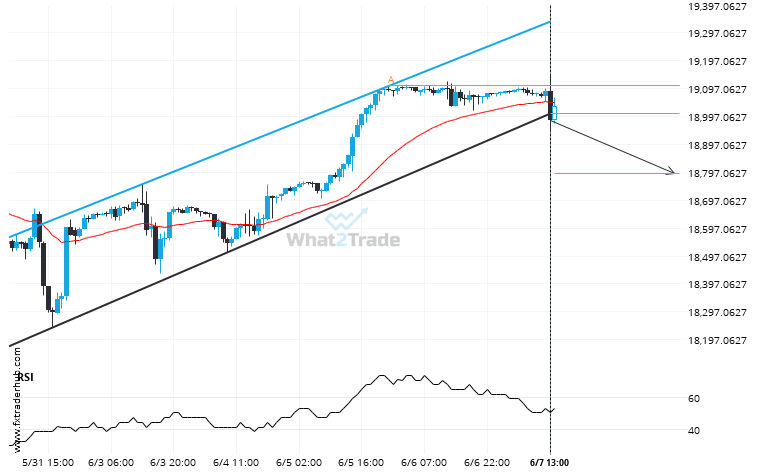
NAS100 has broken through the support line which it has tested twice in the past. We have seen it retrace from this line before, so one should wait for confirmation of the breakout before trading. If this new trend persists, a target level of around 18792.2121 may materialize within the next 2 days.
NAS100 broke through a support at 2024-06-07T14:00:00.000Z, with the price momentum continuing to move in an downward direction over the next hours, good opportunity presents itself with the price expected to reach 18792.2121.