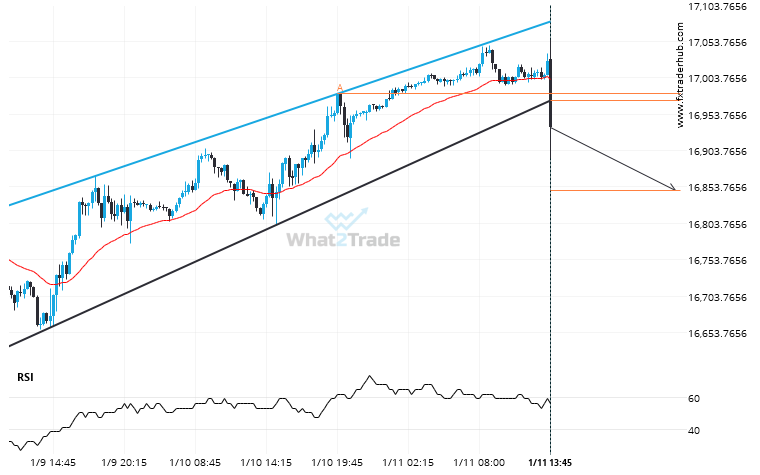
NAS100 moved through the support line of a Channel Up at 16972.731884057972 on the 15 Minutes chart. This line has been tested a number of times in the past and this breakout could mean an upcoming change from the current trend. It may continue in its current direction toward 16848.5387.
NAS100 broke through a support at 2024-01-11T15:30:00.000Z, with the price momentum continuing to move in an downward direction over the next hours, good opportunity presents itself with the price expected to reach 16848.5387.