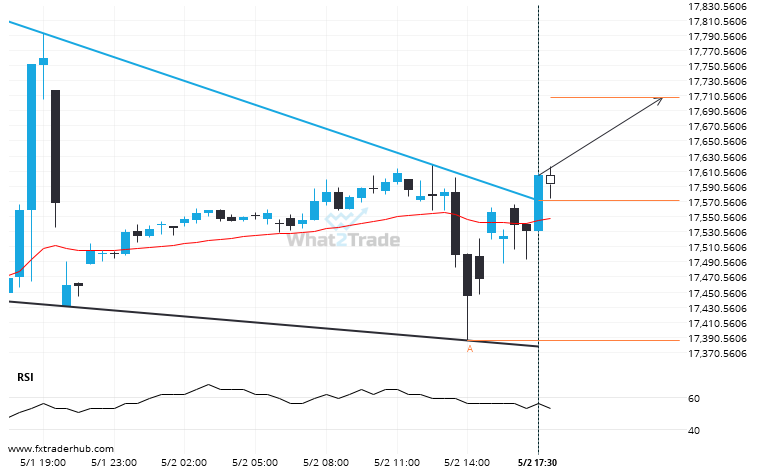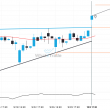
NAS100 has broken through a resistance line of a Falling Wedge chart pattern. If this breakout holds true, we may see the price of NAS100 testing 17707.6292 within the next 6 hours. But don’t be so quick to trade, it has tested this line in the past, so you should confirm the breakout before taking any action.
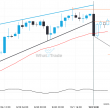
NAS100 broke through a resistance at 2024-05-02T19:00:00.000Z, with the price momentum continuing to move in an upward direction over the next hours, good opportunity presents itself with the price expected to reach 17707.6292.