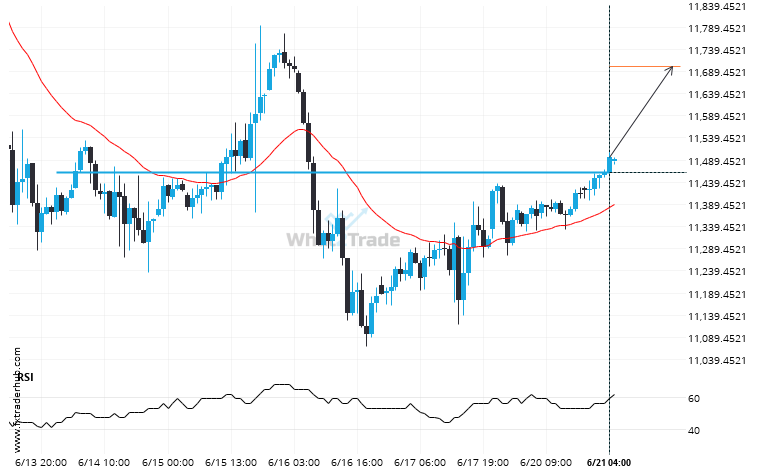
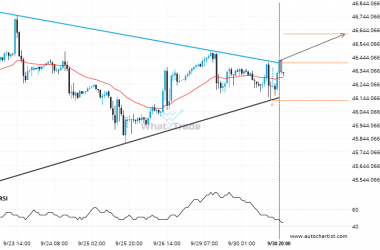
NAS100 has broken through a resistance line. Because we have seen it retrace from this price in the past, one should wait for confirmation of the breakout before trading. It has touched this line numerous times in the last 8 days and suggests a possible target level to be around 11701.2002 within the next 2 days.
Related Posts
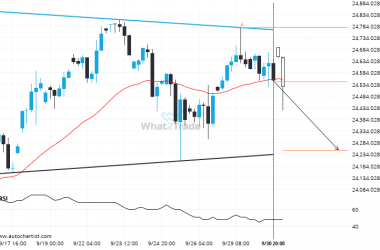
A possible move on NAS 100 as it heads towards support
NAS 100 is approaching the support line of a Triangle. It has touched this line numerous times in…
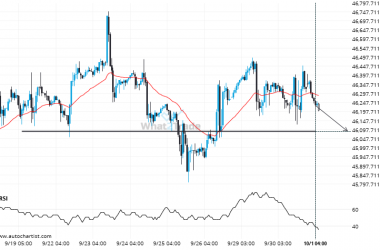
DOW 30 is approaching 46089.0000. We expect either a breakout through this line, or a rebound.
DOW 30 is heading towards a line of 46089.0000. If this movement continues, the price of DOW 30…
After testing resistance twice in the past, DOW 30 has finally broken through. Can we expect a bullish trend to follow?
DOW 30 has broken through a resistance line of a Triangle and suggests a possible movement to 46612.9534…

