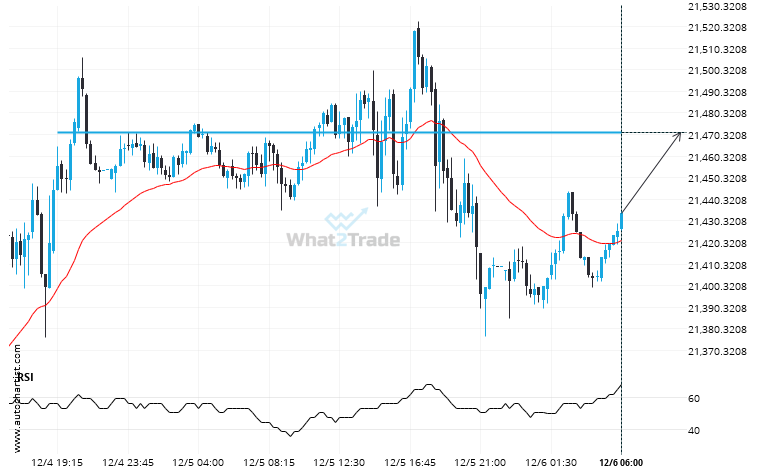
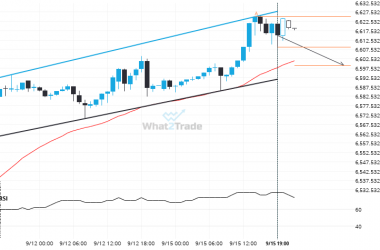
NAS 100 is about to retest a key horizontal resistance level near 21471.1465. It has tested this level 4 times in the recent past and could simply bounce off like it did last time. However, after this many tries, maybe it’s ready to start a new trend.
Related Posts
NAS 100 is signaling a possible trend reversal on the intraday charts with price not breaching support.
Emerging Channel Up pattern in its final wave was identified on the NAS 100 4 hour chart. After…
After trying numerous times in the past, FTSE 100 finally breaks 9165.2197!
FTSE 100 has breached the resistance line at 9165.2197. It may continue the bullish trend towards 9220.1670, or,…
Because DAX 40 formed a Inverse Head and Shoulders pattern, we expect it to touch the resistance line. If it breaks through resistance it may move much higher
DAX 40 is moving towards a resistance line which it has tested numerous times in the past. We…