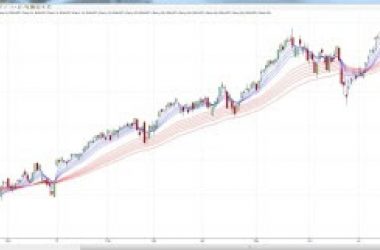
The Multiple Day Mean Reversion System is designed to pick up quick profits from ETFs that wander a little too far from their current trend. It is based on the mean reversion assumption that all markets will eventually revert back to their average price.
Similar to the 3 Day High/Low Mean Reversion System, this one has outperformed the S&P 500 over the past 12 years with a significantly lower drawdown. It is designed to trade a basket of 20 ETFs that represent a broad spectrum of global markets.
The Rules
Go Long When:
- ETF > 200 day SMA
- ETF < 5 day SMA
- ETF has closed lower 4 out of 5 days
Go Short When:
- EFT < 200 day SMA
- ETF > 5 day SMA
- ETF has closed higher 4 out of 5 days
Exit Long When:
- ETF crosses above 5 day SMA
Exit Short When:
- ETF cosses below 5 day SMA
About The System
The Multiple Day Mean Reversion System was popularized by Larry Connors and Caesar Alvarez in their 2009 book High Probability ETF Trading. Like all mean reversion strategies, this approach is based on the assumption that a market that has trended in one direction will eventually revert back to its average price.
This system targets up-trending ETFs that fall below their 5 day simple moving average while closing lower in four out of five days. It also targets the inverse, down-trending ETFs that rise above their 5 day simple moving average while closing higher in four out of five days. After establishing this position, the system holds it until the ETF crosses back above/below its 5 day SMA.
Backtesting Analysis
Backtesting results for this system were posted on Sanz Prophet’s blog in September of 2012. Those results reported the system’s performance from January 1, 2002 through August 1, 2012. During that time, the system made 1,901 trades. Of those trades, 71% were profitable. The compound average return during that time was 9.44%, with a maximum drawdown of 13.37%.
The returns posted by this system over the past decade are impressive, and the low drawdown makes them even more appealing to many investors. The system also performed exceptionally well during the financial meltdown in 2008. While the S&P lost half its value, the Multiple Day Mean Reversion System posted tremendous gains of almost 50%.
Improving The System
Limiting Downside
The Multiple Day Mean Reversion System has the same major flaw as the 3 Day High/Low Mean Reversion System. While both systems have incredibly high win rates, they both have open-ended loss potential on the downside. If the only way to close out a position is for it to cross its 5 day SMA, then you could theoretically be caught holding a long position as it drops to zero. Taking this kind of risk to make a relatively small profit on most of the trades is like picking up nickels in front of a steamroller. You’re just asking to get flattened.
I would be very interested to see how the results would change if a stop-loss element was introduced to the system. Using Bayesian Inference or even a simple ATR Multiple to set the stops would absolutely limit the downside. Those stops could also reduce the overall returns depending on how many of those losing trades eventually close out as small winners.
Selective Implementation
The biggest strength of this system was its performance during the financial meltdown in 2008. Based on that performance, it is obvious that this system works best in highly volatile markets. Therefore, it might be a good idea to implement a volatility condition that would only permit the system to make trades when volatility shot up.
We wouldn’t want a system that only trades one out of every 12 years, so we would have to couple this with an alternative system. However, if we could find a system that worked well during normal markets and underperformed in volatile markets, we could combine the two and have them switch back and forth based on the current volatility conditions. This would allow us to maximize the strengths of each system while minimizing the weaknesses.

