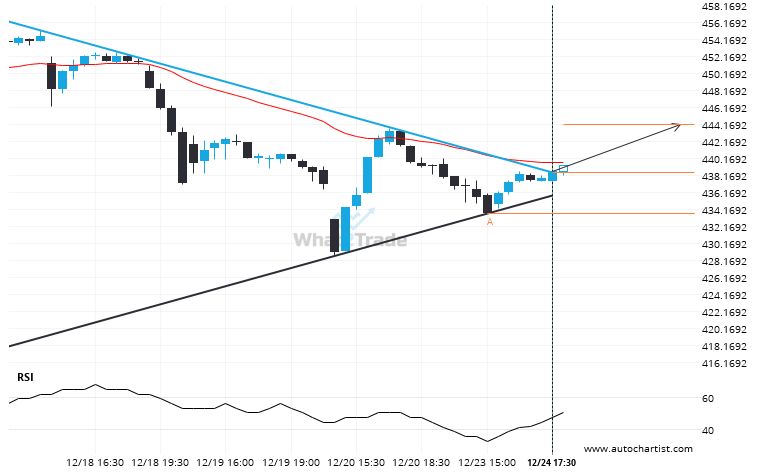
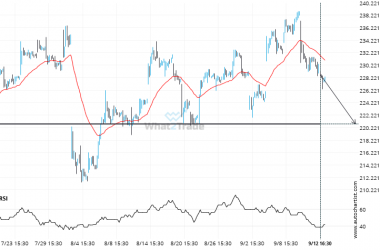
MSFT moved through the resistance line of a Triangle at 438.46939393939397 on the 30 Minutes chart. This line has been tested a number of times in the past and this breakout could mean an upcoming change from the current trend. It may continue in its current direction toward 444.1387.
Related Posts
Big bullish swing on GOOGL – this may be one of its more notable movements in the recent session.
A movement of 20.79% over 25 days on GOOGL doesn’t go unnoticed. You may start considering where it’s…
META – approaching a support line that has been previously tested at least twice in the past
Emerging Rising Wedge detected on META – the pattern is an emerging one and has not yet broken…
AMZN seems to be on its way to support – a possible opportunity?
AMZN is moving towards a support line. Because we have seen it retrace from this level in the…

