Simple systems stand the best chances of succeeding by not becoming overly curve-fit. However, adding a simple filter to a robust system can be a great way to improve its profitability, provided you also analyze how it may alter any risks or biases built into the system. The Moving Average Crossover System with RSI Filter is an excellent example of this.
About The System
This system uses the 30 unit SMA for the fast average and the 100 unit SMA for the slow average. Because its fast moving average is a good bit slower than the SPY 10/100 Long Only Moving Average Crossover System, it should generate less total trade signals. It will be interesting to see if this leads to a higher win rate.
The system also uses the RSI indicator as a filter. This is designed to keep the system out of trades in markets that are not trending, which should also lead to a higher win rate.
The system enters a long position when the 30 unit SMA crosses above the 100 unit SMA if the RSI is above 50. It enters a short position when the 30 unit SMA crosses below the 100 unit SMA if the RSI is below 50.
The system exits a long position if the 30 unit SMA crosses back below the 100 unit SMA, or if the RSI drops below 30. It exits a short position if the 30 unit SMA crosses back above the 100 unit SMA, or if the RSI rises above 70. It also implements a trailing stop that is based on the volatility of the market and sets an initial stop at the most recent low for a long position or the most recent high for a short position.
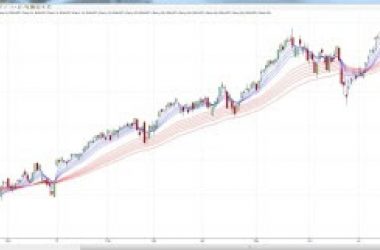
A daily FXI chart, the EURUSD ETF, shows the system rules in action
Trading Rules
Go Long When:
- 30 unit SMA crosses above 100 unit SMA
- RSI > 50
Go Short When:
- 30 unit SMA crosses below 100 unit SMA
- RSI < 50
Exit Long When:
- 30 unit SMA crosses below 100 unit SMA, or
- RSI drops below 30, or
- Trailing Stop is hit, or
- Initial Stop is hit
Exit Short When:
- 30 unit SMA crosses above the 100 unit SMA, or
- RSI rises above 70, or
- Trailing Stop is hit, or
- Initial Stop is hit
Backtesting Results
The backtesting results I found for this system were from the Euro vs US Dollar market from 2004 through 2011 using a daily time period. During those seven years, the system only made 14 trades, so it definitely filtered out a large portion of the action. The question is whether or not it filtered out the good trades or the bad ones.
Of those 14 trades, eight were winners and six were losers. That gives the system a 57% win rate, which we know can be traded very successfully provided the profit rate is also strong.
Backtesting reports for forex systems use a stat called profit factor. This number is calculated by dividing the gross profit by the gross loss. This gives us the average profit we can expect per unit of risk. The results for this backtesting report gave this system a profit factor of 3.61. This means that over the long run, this system will provide positive returns.
For a comparison point, the Triple Moving Average Crossover System only had a profit factor of 1.10, so the Moving Average Crossover System with RSI is likely to be three times more profitable. This means that using a larger number for the fast moving average and adding the RSI filter must be filtering out some of the less productive trades.
These numbers are further supported by the fact that the average profit was just over twice as large as the average loss. However, despite these positive ratios, the system did suffer a maximal drawdown of almost 40%.
Sample Size
The fact that this system gives so few signals is both its biggest strength and its biggest weakness. Placing fewer trades and holding them for longer periods of time will keep transaction costs from becoming a factor. However, analyzing 14 trades that occurred over seven years could lead the results to be skewed because of small sample size.
I am curious how this system would have performed if it was traded across a dozen different currency pairs over the same time period. Furthermore, how would it have performed if the backtest went back 50 years or tested the system on stock indexes or commodities. There is clearly positive stats to warrant further exploration of this system, but it would be foolish to trade real money based on the results of 14 trades.
Trading Example
An example of this system at work can be seen on the current chart of the FXI. Around March 18 of this year, the 30 day SMA crossed below the 100 day SMA. At that time, the RSI was also below 50. This would have triggered a short position somewhere just below 36. The initial stop would probably have been placed above the recent high at 38.
By mid-April, the price had dropped to 34 and we would have been sitting on a nice profit. The price then rebounded to almost trigger our initial stop at 38 in early May before crashing almost all the way down to 30 at the end of June. It has since bounced back to the 34 range.
At no point during any of this action did the 30 day SMA cross back above the 100 day SMA, and the RSI remained below 70. Therefore, neither of those would have triggered an exit. While the price came close to our initial stop, it did not quite get there, so that would have kept us in the trade as well.
The only thing that could have caused an exit would have been the trailing stop, which would have depended on how much volatility we set it to allow for. It is still to early to say whether we would want to have been stopped out or not.
About the RSI Indicator
The RSI indicator was developed by J. Welles Wilder and was featured in his 1978 book, New Concepts in Technical Trading Systems. It is a momentum indicator that oscillates between zero and 100, indicating the speed and change in price. Many momentum traders use RSI as an overbought/oversold indicator.
RSI is calculated by first calculating RS, which is the average gain of the last n periods divided by the average loss of the last n periods. The value for n is generally 14 days.
RS = (Average Gain) / (Average Loss)
Once RS is calculated, the following equation is used to make that value into an oscillating indicator:
RSI = 100 – [ 100 / (1 + RS) ]
This will give us a value between zero and 100. Any value above 70 is generally considered overbought, and any value below 30 is considered oversold. However, since this system is a trend following system, overbought and oversold do not have their usual negative connotations.

