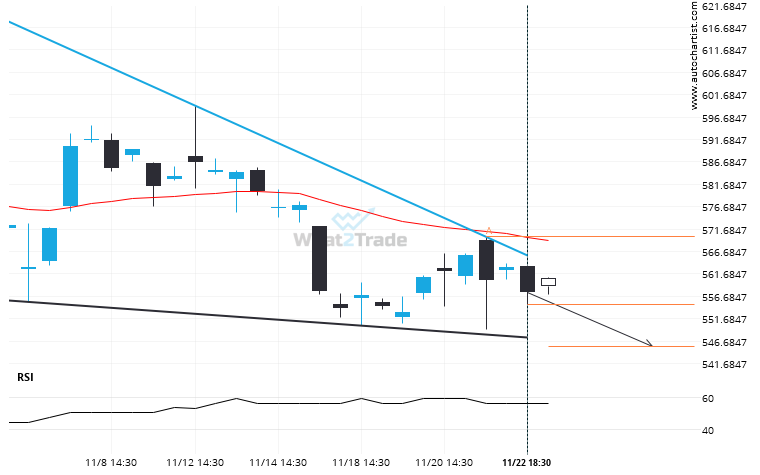
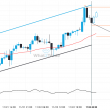
Emerging Falling Wedge pattern in its final wave was identified on the META 4 hour chart. After a strong bearish run, we find META heading towards the upper triangle line with a possible resistance at 545.4313. If the support shows to hold, the Falling Wedge pattern suggests a rebound back towards current levels.
Related Posts
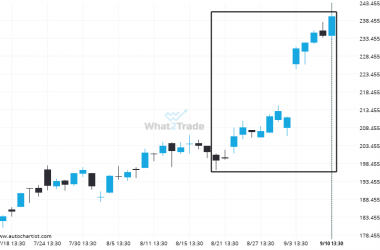
Extreme movement experienced on GOOGL. Check the chart to see what to do next.
GOOGL has moved higher by 20.22% from 199.31 to 239.61 in the last 22 days.
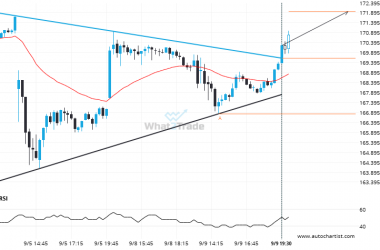
Resistance line breached by NVDA. This price has been tested at least twice before.
NVDA has broken through a resistance line. It has touched this line at least twice in the last…
BABA recorded 6 consecutive 4 hour bullish candles.
BABA posted 6 consecutive candles over the last 5 day — an unusually large movement.

