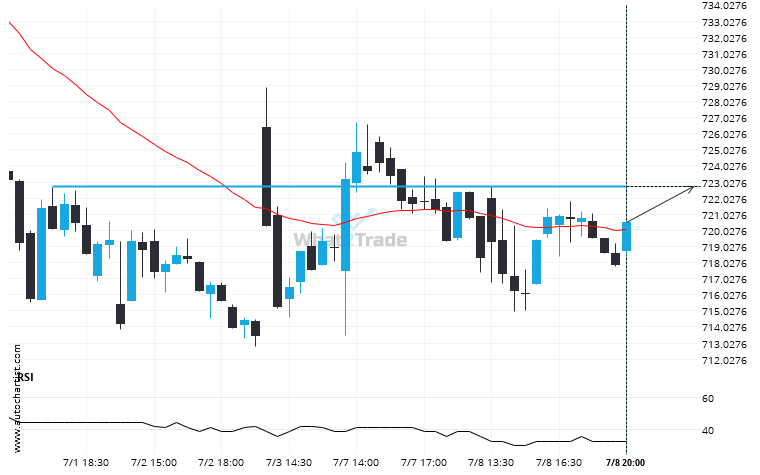
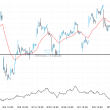
META is moving towards a key resistance level at 722.7450. META has previously tested this level 3 times and on each occasion it has bounced back off this level. Is this finally the time it will break through?
Related Posts
INTC hits 20.4100 after a run of 6 consecutive 4 hour candles spanning 6 days.
Due to the rate of consecutive bearish candles on INTC 4 hour chart we could be in for…
V is signaling a possible trend reversal on the intraday charts with price not breaching resistance.
Emerging Triangle pattern in its final wave was identified on the V 4 hour chart. After a strong…
If you’re short XOM you should be aware that 112.4750 has just been breached – a level tested 3 time in the past
XOM has broken through a resistance line. It has touched this line numerous times in the last 27…