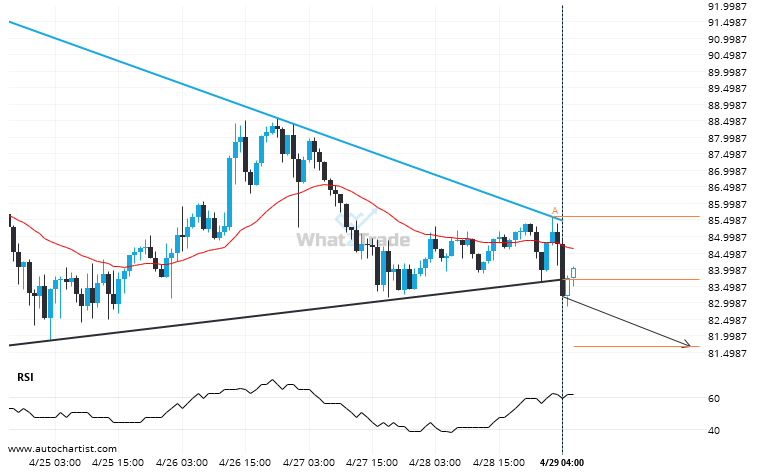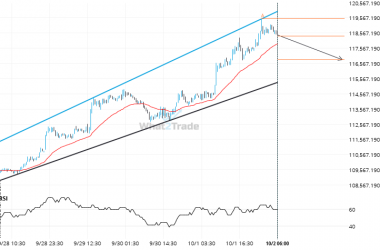
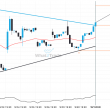
LTCUSD moved through the support line of a Triangle at 83.68569892473118 on the 1 hour chart. This line has been tested a number of times in the past and this breakout could mean an upcoming change from the current trend. It may continue in its current direction toward 81.6669.
LTCUSD broke through a support at 2024-04-29T05:00:00.000Z, with the price momentum continuing to move in an downward direction over the next hours, good opportunity presents itself with the price expected to reach 81.6669.