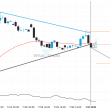
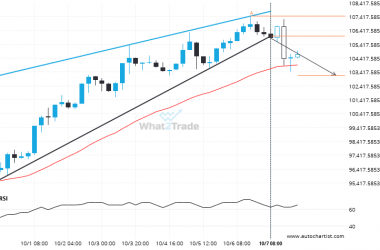
LTCEUR was identified at around 94.94 having recently rebounded of the resistance on the 4 hour data interval. Ultimately, the price action of the stock has formed a Triangle pattern. This squeeze may increases the chances of a strong breakout. The projected movement will potentially take the price to around the 93.0946 level.
LTCEUR formed a Triangle on the 4 hour chart. Retest of support in sight.