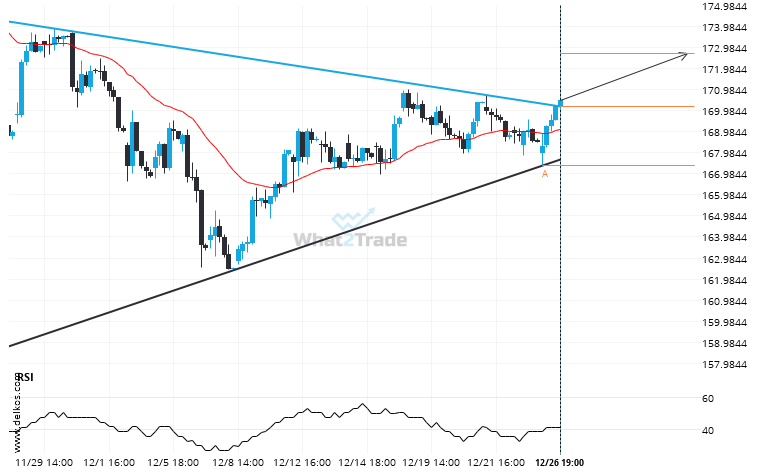
Live Cattle February 2024 moved through the resistance line of a Triangle at 170.1595744680851 on the 1 hour chart. This line has been tested a number of times in the past and this breakout could mean an upcoming change from the current trend. It may continue in its current direction toward 172.6787.
Related Posts
Important support line being approached by Gold Spot. This price has been tested numerous time in the last 4 days
Emerging Falling Wedge pattern in its final wave was identified on the Gold Spot 1 hour chart. After…
If US Oil touches 68.8210 it may be time to take action.
US Oil is approaching a resistance line at 68.8210. If it hits the resistance line, it may break…
Silver Spot is signaling a possible trend reversal on the intraday charts with price not breaching support.
A Rising Wedge pattern was identified on Silver Spot at 39.0778, creating an expectation that it may move…