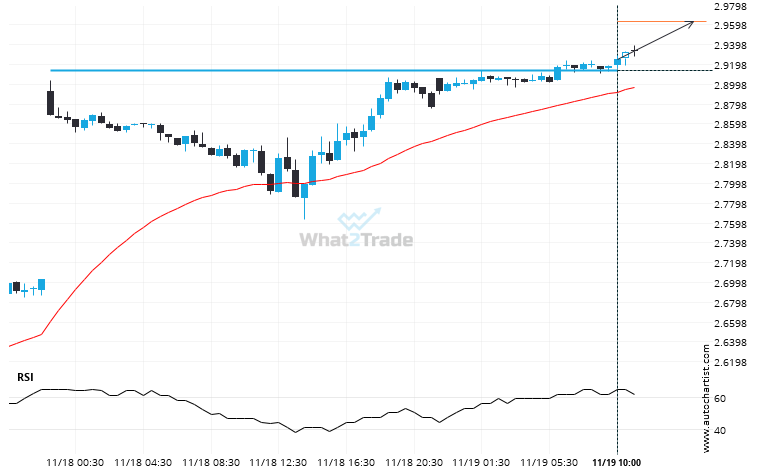
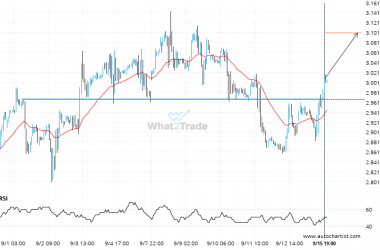
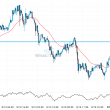
A strong resistance level has been breached at 2.9135 on the 30 Minutes Natural Gas chart. Technical Analysis theory forecasts a movement to 2.9634 in the next 7 hours.
Related Posts
After trying numerous times in the past, Silver Spot finally breaks 31.9950!
The price of Silver Spot in heading in the direction of 32.4764. Despite the recent breakout through 31.9950…
Because US Oil formed a Channel Down pattern, we expect it to touch the support line. If it breaks through support it may move much lower
US Oil is moving towards a support line. Because we have seen it retrace from this line before,…
Because Gold Spot formed a Inverse Head and Shoulders pattern, we expect it to touch the resistance line. If it breaks through resistance it may move much higher
Gold Spot is trapped in a Inverse Head and Shoulders formation, implying that a breakout is Imminent. This…