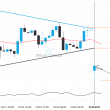
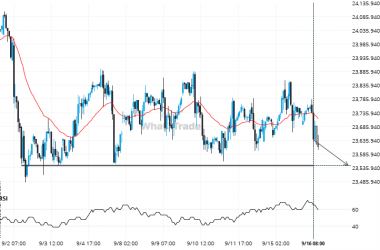
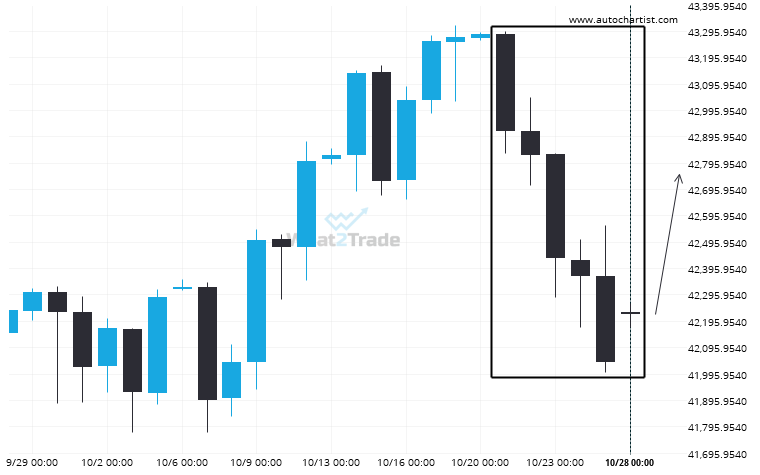
DOW 30 has moved lower after 6 consecutive daily candles from 43285.1200 to 42222.0300 in the last 8 days.
Related Posts
FTSE 100 is signaling a possible trend reversal on the intraday charts with price not breaching resistance.
An emerging Channel Up has been detected on FTSE 100 on the 4 hour chart. There is a…
After testing 44490.4492 numerous times, DOW 30 has finally broken through. Can we expect a bearish trend to follow?
DOW 30 has broken through 44490.4492 which it has tested numerous times in the past. We have seen…
US 500 has broken through resistance of a Triangle. It has touched this line at least twice in the last 6 days.
US 500 has broken through a resistance line of a Triangle chart pattern. If this breakout holds true,…