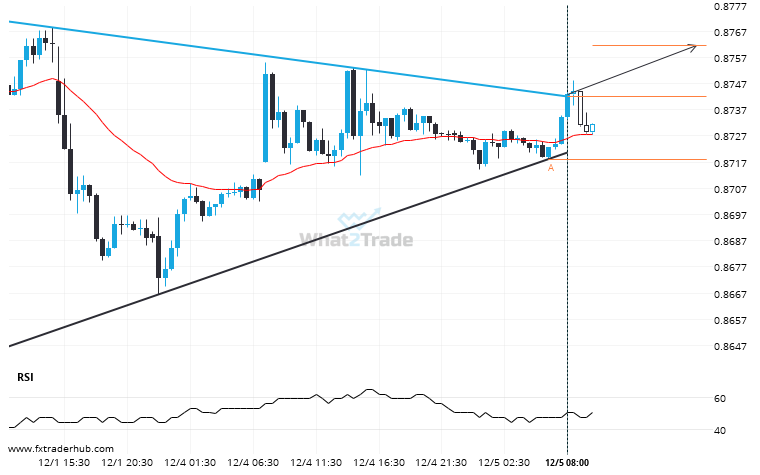
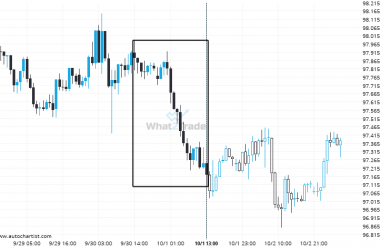
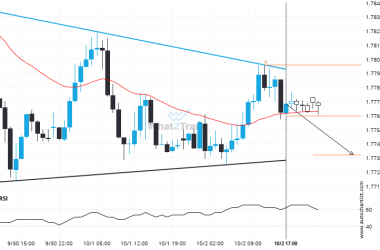
USD/CHF moved through the resistance line of a Triangle at 0.8742295999999999 on the 30 Minutes chart. This line has been tested a number of times in the past and this breakout could mean an upcoming change from the current trend. It may continue in its current direction toward 0.8762.
Related Posts
An unexpected large move has occurred on GBPCHF Daily chart! Is this a sign of something new? What can we expect?
GBPCHF experienced an extremely large move that lasted 29. This movement is in the 2.0 percentile and is…
GBPJPY moves lower to 197.0830 in the last 4 days.
GBPJPY has experienced an unusual quantity of bearish candles on the Daily timeframe. This is in the 0.949999988079071…
USDJPY breakout from a Falling Wedge trade setup. Will it continue this trend to hit the target price?
USDJPY moved through the resistance line of a Falling Wedge at 143.70335714285713 on the 4 hour chart. This…